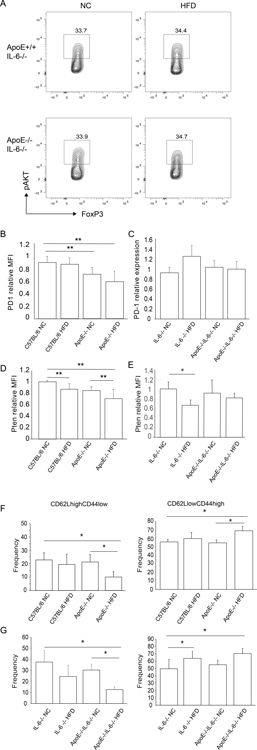
Figure 4. Effects of IL-6 deficiency on regulatory T cell phenotype.
Groups of mice were fed high fat diet (HFD) or normal chow for a minimum of four weeks. Animals were sacrificed, and splenic Tregs examined by flow cytometry to assess Akt phosphorylation (pAkt). (A) Representative flow plots gated on live CD4+FoxP3+ splenocytes. (B) MFI of PD-1 relative to C57BL/6 controls in CD4+CD44hiCD62LloFoxP3+ splenocytes for indicated IL-6 replete groups of mice. Shown are the combined results of three independent experiments. (C) MFI of PD-1 relative to C57BL/6 controls in CD4+CD44hiCD62LloFoxP3+ splenocytes for indicated IL-6 deficient groups of mice. Shown are the combined results of three independent experiments. (D) Pten in IL-6 replete groups of hyperlipidemic mice. Shown is the MFI of Pten relative to C57BL/6 controls in CD4+FoxP3+ splenocytes. Combined results of three independent experiments. (E) Pten in IL-6 deficient groups of hyperlipidemic mice. Shown is the MFI of Pten relative to C57BL/6 controls in CD4+FoxP3+ splenocytes. Combined results of two independent experiments. (F) Frequency of CD4+CD44loCD62LhiFoxP3+ and CD4+CD44hiCD62LloFoxP3+ Tregs in indicated groups of IL-6 replete mice. Shown is combined results of three independent experiments. (G) Frequency of CD4+CD44loCD62LhiFoxP3+ and CD4+CD44hiCD62LloFoxP3+ Tregs in indicated groups of IL-6 deficient mice. Shown is combined results of three independent experiments. Statistical significance was determined by Student’s t-test. Asterisk indicates P < 0.05.

