
Figure 1. Cell type diversity in the human hippocampal-entorhinal system revealed by snRNA-seq.
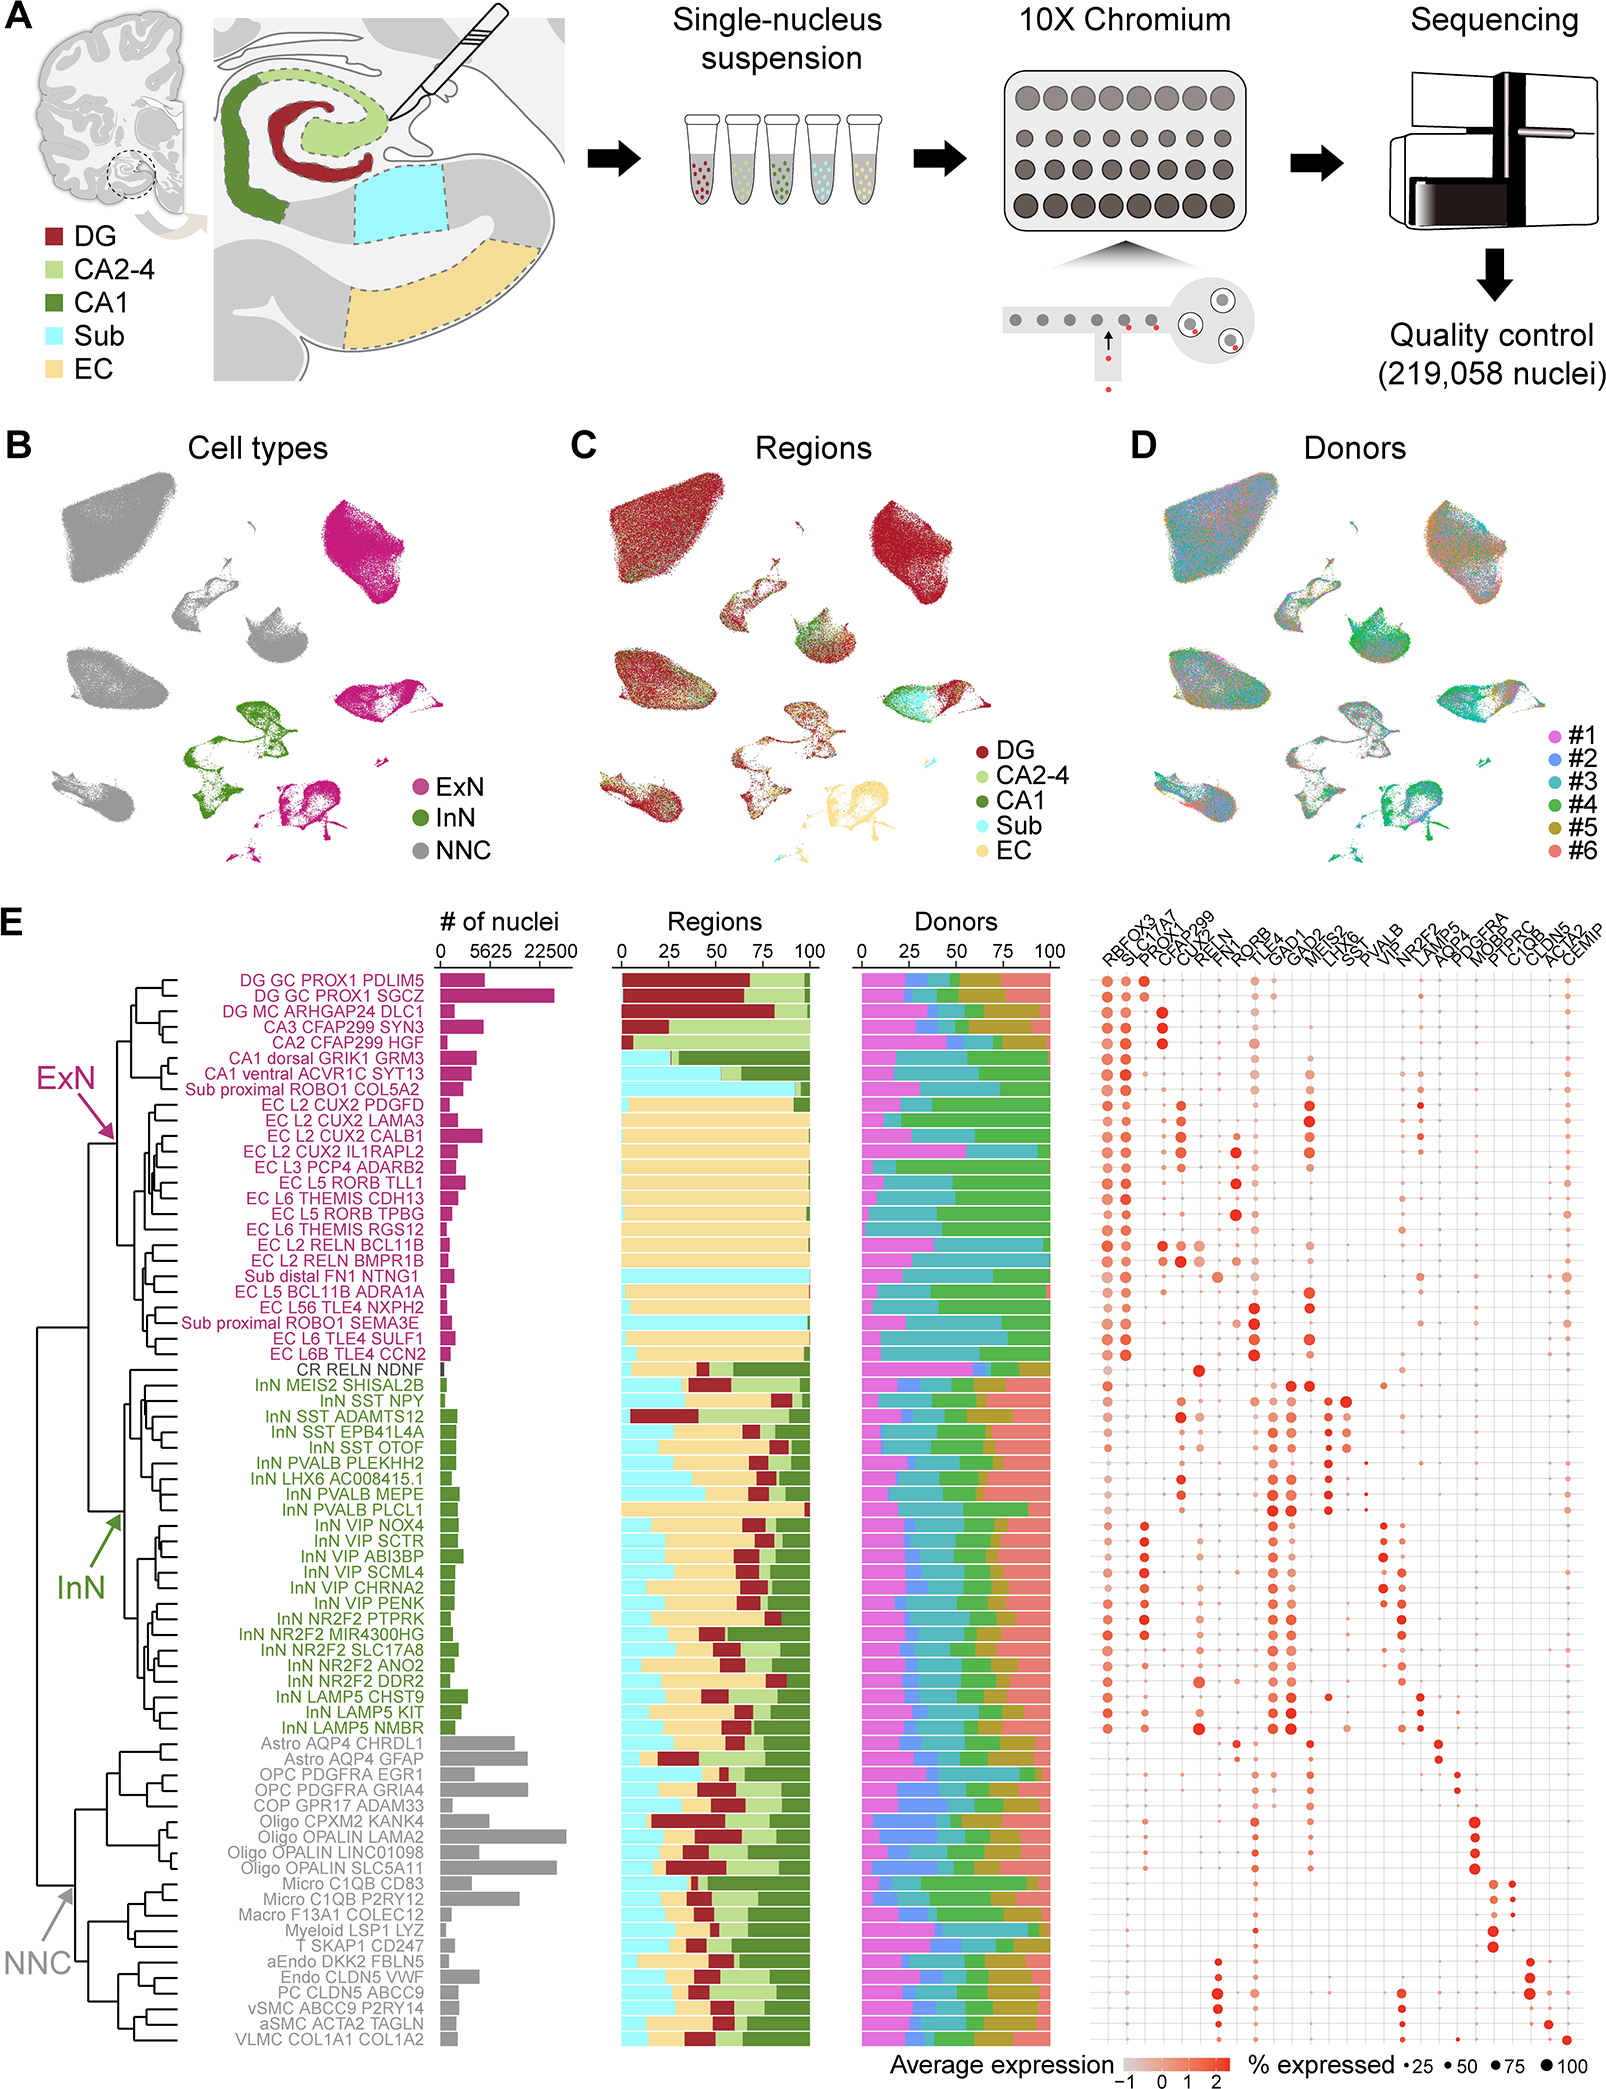
A, Schematic of the analytic workflow. B-D, UMAP visualization of all nuclei, colored by major cell types (B), subregions (C), and donors (D). E, Dendrogram depicting the hierarchical taxonomy across all cell subtypes. Bar plots show the number of nuclei, relative subregional and donor contributions, with coloring scheme conforming to panel B-D. Dot plot shows the expression of marker genes. GC, granule cell; MC, mossy cell; Astro, astrocyte; OPC, oligodendrocyte precursor cell; COP, committed OPC; Oligo, oligodendrocyte; Micro, microglia; Macro, macrophage; Myeloid, myeloid cell; T, T cell; aEndo, arterial endothelial cell; PC, pericyte; vSMC, venous smooth muscle cell; aSMC, arterial smooth muscle cell; VLMC, vascular and leptomeningeal cell. See also Figure S1.