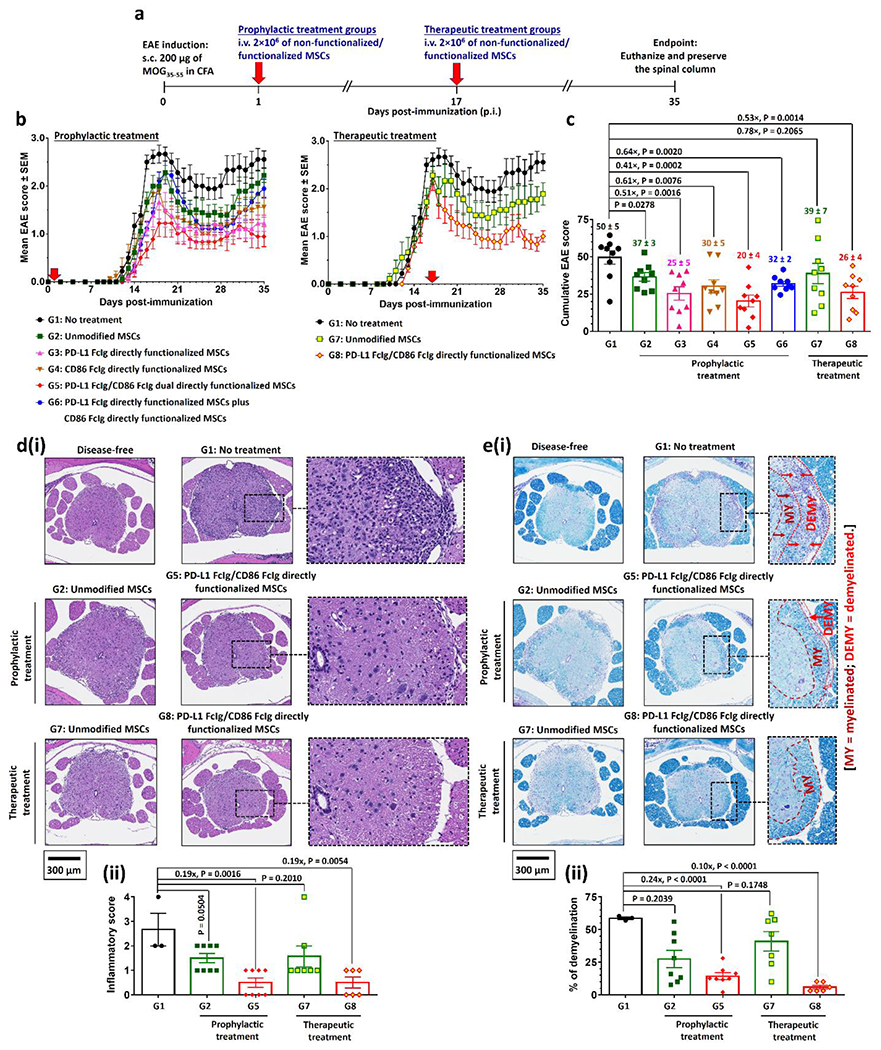
Figure 4.

PD-L1 FcIg and CD86 FcIg directly functionalized MSCs prophylactically and therapeutically suppress MOG35-55-induced EAE in vivo. a) Prophylactic and therapeutic treatment schedules after immunization with MOG35-55 peptide. 2×10⁶ of unmodified or functionalized MSCs were i.v. administrated 1 day (prophylactic treatment) or 17 days (therapeutic treatment) post-immunization (p.i.). Body conditions were monitor daily until day 35 p.i. Mice were euthanized day 36 or 37 p.i. The spinal columns were preserved for further histopathological studies. b) Time-dependent mean clinical scores of EAE inflicted mice after received different prophylactic or therapeutic treatments. In the absence of treatment, EAE progress from partial tail paresis (score 0.5), complete tail paresis (score 1.0), limp tail and hind leg inhibition (score 1.5), limp tail and weakness of hind legs (score 2.0), limp tail and no movement in one leg (score 2.5), to complete hind limb paralysis (score 3.0). (n = 9 mice per group.) c) Cumulative EAE scores of EAE inflicted mice after received different treatments. d)(i) Representative hematoxylin and eosin (H&E)-stained spinal cord sections preserved from healthy disease-free mouse and EAE-inflicted mice after received different prophylactic and therapeutic treatments with directly functionalized MSCs. (ii) Quantification of spinal inflammation from the H&E-stained images of spinal cords. (n = 3 for the non-treatment group; n = 8 for both prophylactic treatment groups; n = 7 for therapeutic treatment group treated with the non-functionalized MSCs; n = 6 for the therapeutic treatment group treated with the functionalized MSCs.) e)(i) Representative Luxol fast blue (LFB)-stained spinal cord sections preserved from healthy disease-free mouse and EAE-inflicted mice after received different prophylactic and therapeutic treatments with directly functionalized MSCs. Myelin fibers and phospholipids appear blue to green, neuropil appears pink, and nerve cells appear purple. (ii) Quantification of demyelination from the LFB-stained images of spinal cords. (n = 3 for the non-treatment group; n = 8 for both prophylactic treatment groups; n = 7 for therapeutic treatment group treated with the non-functionalized MSCs; n = 6 for the therapeutic treatment group treated with the functionalized MSCs.)
