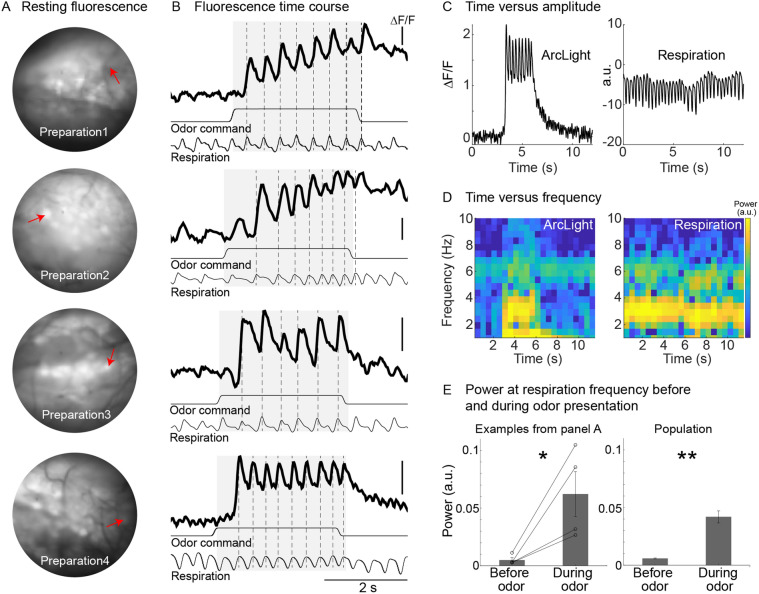
Figure 2.
Odor-evoked activity in the olfactory receptor neurons (input) recorded with ArcLight in OMP-ArcLight transgenic mice. (A) Baseline fluorescence from four different preparations. (B) Single-trial recordings from the glomeruli indicated in panel A showing the ability of ArcLight to track the animal’s respiration. The traces are low pass filtered at 12 Hz. Each row is from a different preparation. Scale bars all indicate −1% ∆F/F. (C) Time versus amplitude plots for the ArcLight and respiration trace from the bottom preparation in panels A, B. (D) Time versus frequency graphs of the corresponding traces in panel C. (E) Average power at the respiratory frequency prior to and during odor presentation for the examples in A, B (left panel), and for a population of glomeruli (right panel). *p < 0.05; **p < 0.001.

