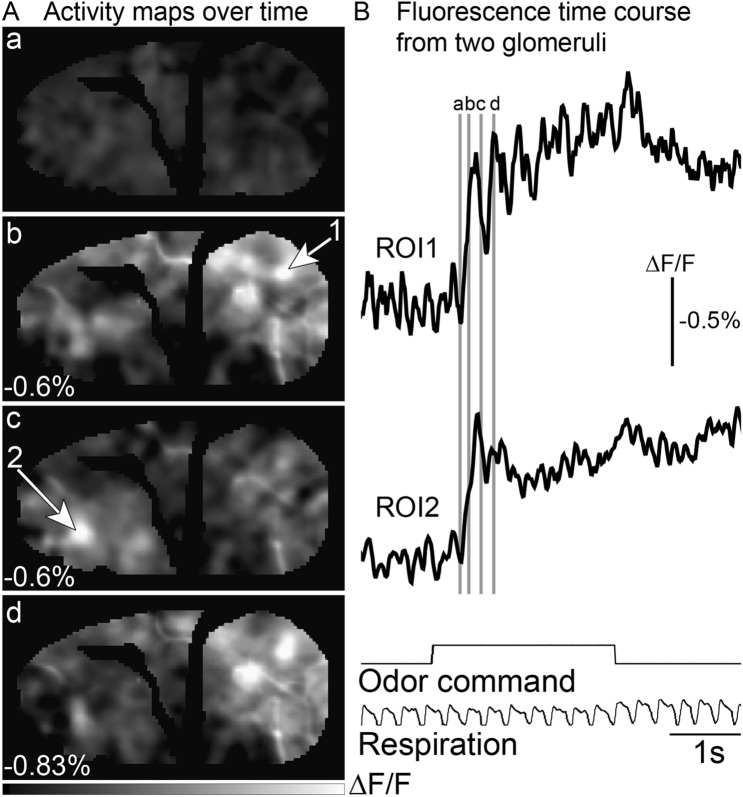
Figure 4.
Dynamics of odor-evoked signals. (A) Activity maps were measured at 4 different time points: prior to odor (a), and at three time points (b-d) following the animal’s inspiration of the odor stimulus. The maps are scaled to 90% of the maximum value pixel value (number in the bottom left corner of each panel). (B) Fluorescence time course of odor-evoked signals
taken from glomeruli located in the caudal and rostral bulb, respectively (ROIs indicated by the arrows in panel A). The black trace is the average of two single trials aligned to the first breath. The traces are low pass filtered at 12 Hz. The time points used for the activity maps in panel A are indicated by the gray lines.

