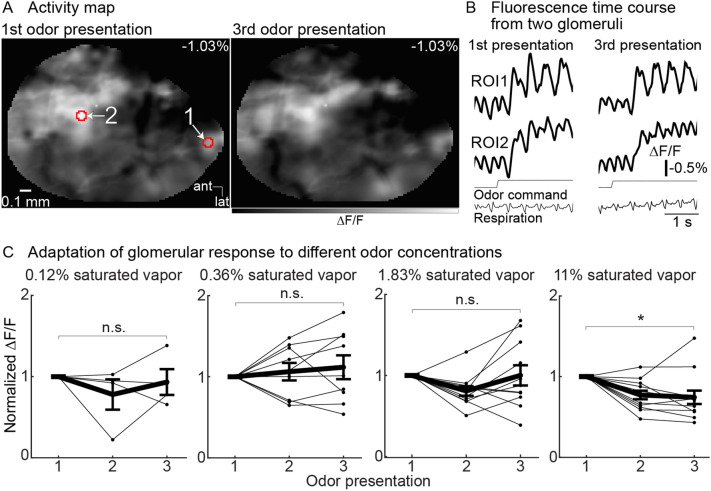
Figure 5.
Olfactory receptor neuron glomeruli exhibit minimal adaptation in response to repeated 3-s presentations separated by a 6-s interval. (A) Activity map of neuronal activity evoked by 1.83% of saturated vapor (methyl valerate) in response to the 1st (left panel) and 3rd (right panel) odor presentation. The maps are scaled to the same min and max range. (B) Fluorescence traces from the two glomeruli indicated in panel A. The traces are cropped to illustrate the response to the 1st (left column) and 3rd (right column) odor presentation and are low pass filtered at 12 Hz. (C) Population normalized response amplitude of repeated odor presentations at four different odor concentrations. Each line indicates the mean response of all activated glomeruli to an odor from a single preparation. The mean ± s.e.m. responses across all preparations are shown as thick black lines. *p < 0.01.

