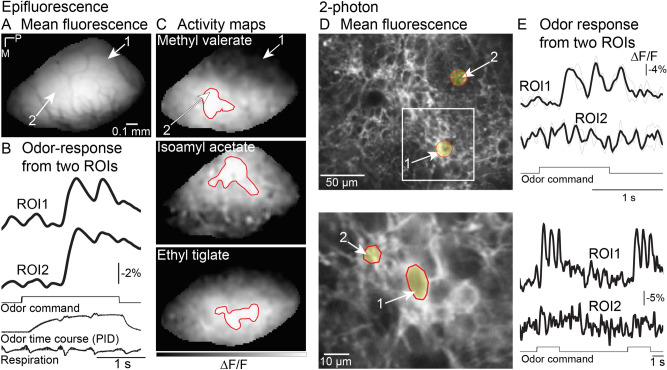
Figure 6.
In vivo imaging from the Emx1-ArcLight transgenic mouse. (A-C) Epifluorescence imaging. (A) Resting fluorescence from the olfactory bulb. (B) Fluorescence traces from two regions of interest (ROIs indicated by arrows in panel A). Traces are low pass filtered at 4 Hz. (C) Activity maps evoked by three different odors. Activity maps are spatially filtered with one 3 × 3 iteration of a gaussian low-pass filter. The red contours indicate the area with ∆F/F values between 95–100% of the maximum response. (D, E) 2-photon imaging. (D) (top) Resting fluorescence from the glomerular layer illustrating weak expression in the glomeruli, and brighter fluorescence on the edges of the glomeruli. (bottom) A higher magnification recording from the area illustrated by the white box. (E) (top) Odor-evoked activity could be detected from the areas of bright expression around the glomeruli. (bottom). The signals are low pass filtered at 2 Hz. The black traces in the top panel are an average of two trials (gray lines). The black traces in the bottom panel are single trials. P, posterior; M, medial.

