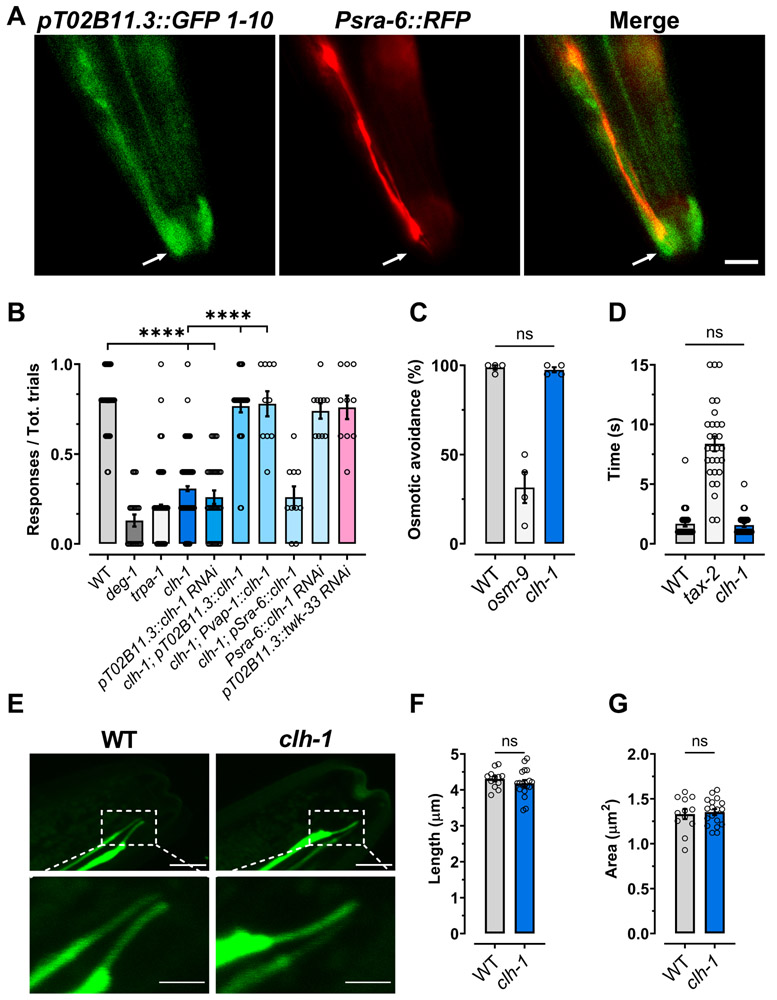
Fig. 1. CLH-1 in needed in amphid glia for nose touch responses.
(A) Representative images of a worm expressing GFP11x7::clh-1 knock-in, pT02B11.3::GFP1-10, and Psra-6::RFP taken with GFP (left) and RFP (middle) filters. The panel on the right is a merge of the first two panels. Arrows indicate the position of the sensory cilia. Scale bar: 5 μm. (B) clh-1(ok658) knockout worms are nose touch insensitive. The nose touch insensitivity is rescued by expression of clh-1 cDNA under the control of AMsh glia specific promoters T02B11.3 and vap-1 (Bacaj et al., 2008, Perens and Shaham, 2005), but not under the control of ASH neurons’ promoter sra-6 (Troemel et al., 1995). Nose touch insensitivity is also observed in animals in which clh-1 is knocked down in AMsh glia by RNAi, but not in animals in which clh-1 is knocked down in ASH neurons, and in which unrelated twk-33 gene is knocked down in AMsh glia. Nose touch insensitive deg-1(u38u421) and trpa-1(ok999) mutants are the negative controls. Each data point represents one worm (n = 270, 20, 270, 210, 30, 30, 10, 10, 10 and 10, respectively). (C) Knockout of clh-1 does not alter osmotic avoidance behavior in C. elegans. Each data point represents an independent experiment (n = 4) in which at least 20 worms each were tested. (D) The octanol avoidance response is normal in clh-1(ok658) mutant worms. Each data point represents one worm (n = 28, 29 and 30, respectively). (E) Representative images of the ASH cilia in wild type (left panels) and clh-1(ok658) (right panels) worms. Bottom panels are insets of the top panels (dashed square box). Scale bar: 2 μm. (F-G) clh-1 knockout does not alter the length (F) or the area (G) of the sensory cilia in ASH neurons. Each data point represents one worm (WT, n = 12; clh-1, n = 18). B-D, F, G: Columns represent mean ± SEM. Statistics were calculated by one-way ANOVA followed by Tukey post-test (ns, not significant (p>0.05); ****p<0.0001) for panels B, C, and D, and by two-tailed unpaired t-Test for panels F and G.

