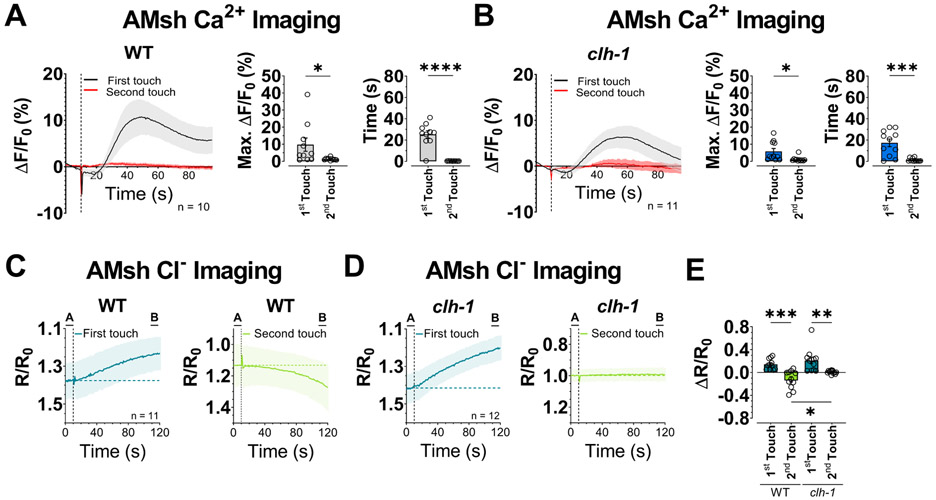
Fig. 3. CLH-1 mediates Cl− efflux upon touch stimulation.
(A-B) Left panels, Calcium transients generated in AMsh glia by two nose touch stimulations as measured by % increase of GCaMP-6s fluorescence above the baseline (ΔF/F) in wild type (A) and clh-1(ok658) (B) worms. Data are shown as mean ± SEM (light gray and red). The first touch is shown in black, the second in red. The number of animals tested is shown within each panel. The vertical dashed line shows when the touch stimulation was delivered. Middle panels, peak percentage (%) of GCaMP-6s ΔF/F. Right panels, GCaMP-6s fluorescence decay time constants. Individual data points are shown as symbols and columns represent mean ± SEM. (C-D) Intracellular Cl− in AMsh glia of wild type (C) and clh-1 knockout (D) worms upon touch stimulation as measured by SuperClomeleon fluorescence. Data represent the YFP/CFP ratio (R) change with respect to the baseline (R0, 10 seconds before touch). Data are mean ± SEM. The number of animals tested is shown in the first touch panel. The vertical dashed line shows when the touch stimulation was delivered. The horizontal dashed line represents the average R/R0 of the 10 seconds before touch. The left panels with traces in dark green correspond to the first touch, the right panels with traces in light green correspond to the second touch. (E) Average R/R0 change of the last 10 seconds of recording with respect to the baseline (B – A in panels C and D). Data are individual worms (symbols) and mean ± SEM (columns). Statistics were by two-tailed unpaired t-Test (ns, not significant (p>0.05), *p<0.05, **p<0.01, ***p<0.001, ****p<0.0001). One-way ANOVA followed by Tukey post-test (*p<0.05, **p<0.01, ***p<0.001) was used for panel E.

