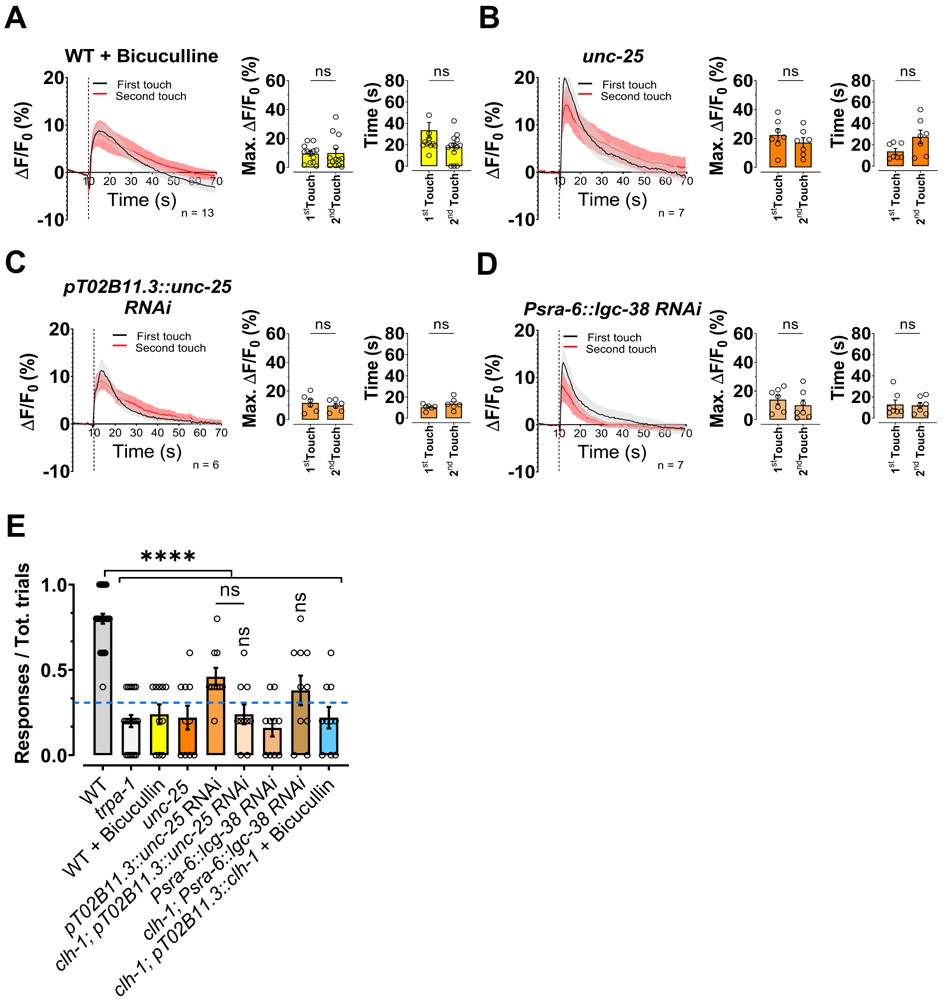
Figure 4. ASH calcium transients’ adaptation to touch is mediated by GABA and loss of GABA signaling causes nose touch insensitivity.
(A-D) Left panels, calcium transients in ASH neurons upon two consecutive nose touch stimulations in wild type animals treated with bicuculline (A), in unc-25(e156) mutants (B), in animals in which the unc-25 has been knocked down in AMsh glia (C), in animals in which the GABAA receptor lgc-38 has been knocked down in ASH neurons (D). Data are shown as mean ± SEM (light gray and red). The first touch is in black and the second in red, the number of animals tested is shown in each panel. The vertical dashed line is when the touch stimulation was delivered. Middle panels, peak percentage (%) of GCaMP-6s ΔF/F. Right panels, time constants of fluorescence decay. Individual data points are shown as open circles, averages are shown as columns. We note that Ca2+ transients in unc-25 and lgc-38 RNAi animals are in general faster than in wild type, possibility due to the stronger buffering capacity of GCaMP-5 versus GCaMP-6s (Chen et al., 2013). (E) Behavioral nose touch responses for wild type, trpa-1(ok999), wild type animals treated with bicuculline, unc-25(e156) mutants, unc-25 AMsh glial RNAi, clh-1; unc-25 AMsh glial RNAi, animals in which the GABAA receptor lgc-38 has been knocked down in ASH neurons, clh-1; lgc-38 RNAi in ASH, and clh-1 AMsh glia rescue treated with bicuculline. Columns represent mean ± SEM and each point represent one worm (n= 30, 20, 10, 10, 10, 10, 10, 10 and 10 respectively). The blue dashed line represents the clh-1 knockout nose touch response from Fig. 1B. Statistics were calculated using two-tailed unpaired t-Test (A-D) or one-way ANOVA followed by Tukey post-test (ns, not significant (p>0.05), ****p<0.0001) (E). Vertical asterisks in panel E are for statistics vs clh-1 knockout.

