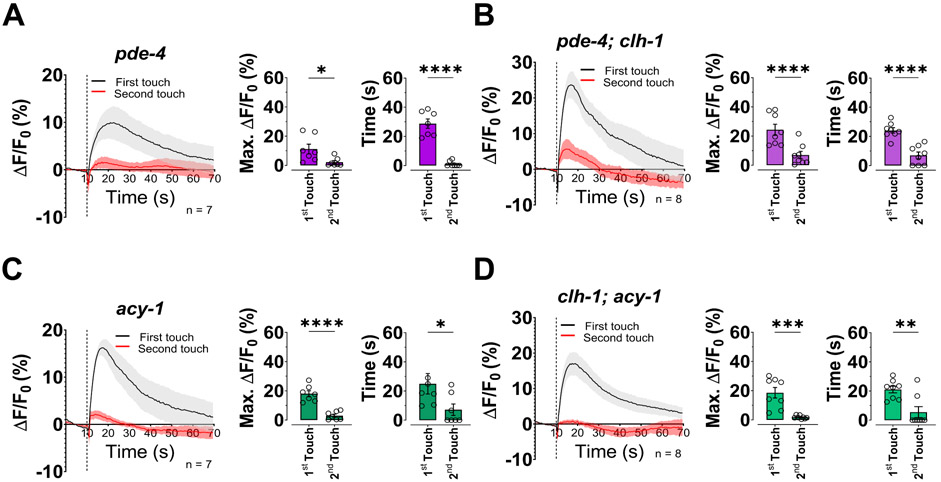
Fig. 7. The adaptation to touch of ASH neurons in clh-1 worms is rescued by increased cAMP levels.
(A-D) Left panels, calcium transients in in ASH neurons upon two consecutive nose touch stimulations in pde-4 (A), pde-4; clh-1 (B), acy-1 (C), and clh-1; acy-1 (D) worms. Data are shown as mean ± SEM (light gray and red). The first touch is in black and the second in red, the number of animals tested is in each panel. The vertical dashed line is when the touch stimulation was delivered. Middle panels, peak percentage (%) of GCaMP-6s ΔF/F. Right panels, time constants of fluorescence decay. Individual data points are shown as open circles, averages are shown as columns. Data are expressed as mean ± SEM. Statistics were calculated using two-tailed unpaired t-test (*p<0.05; **p<0.01; ***p<0.001; ****p<0.0001).

