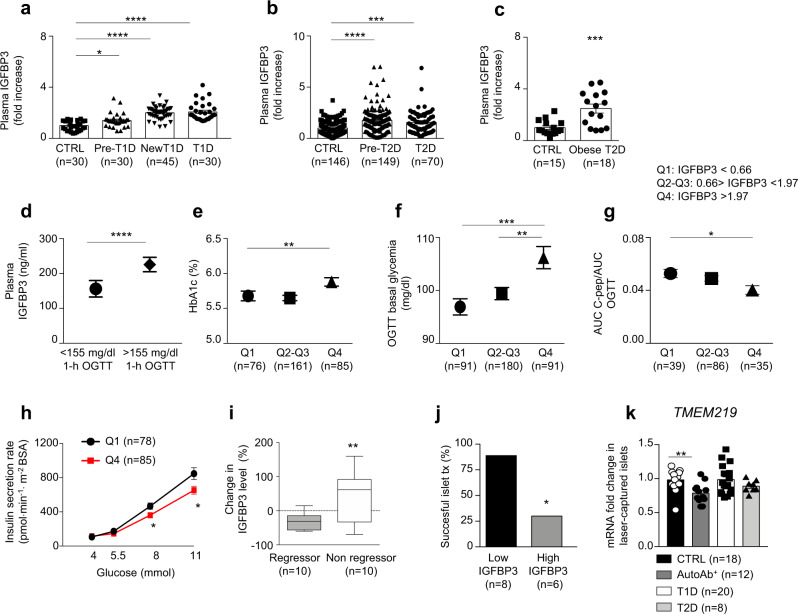
Fig. 2. Peripheral levels of TMEM219 ligand IGFBP3 are altered in diabetic patients.
a Scatter plots representing fold increase in peripheral IGFBP3 in patients with established T1D (n = 30), with new-onset T1D (n = 45), at risk for developing T1D (with at least one detected autoantibody, pre-T1D, n = 30), as compared to non-diabetic healthy controls (CTRL, n = 30). Demographic characteristics are reported in Supplementary Table 1. b Scatter plots representing fold increase in peripheral IGFBP3 patients with newly diagnosed T2D (n = 70), at risk for developing T2D (with altered glucose tolerance, pre-T2D, n = 149) as compared to non-diabetic healthy controls (with normal glucose tolerance, NGT, n = 146). Demographic characteristics are reported in Supplementary Table 2. c Box plot showing fold increase in peripheral IGFBP3 in obese T2D patients undergoing bariatric surgery (n = 18, white) as compared to non-diabetic healthy controls (n = 15, black). d Bar graph representing mean ± SEM peripheral IGFBP3 in patients with 1- h blood glucose level >155 mg/dl (n = 256) at the oral glucose tolerance test (OGTT) as compared to those with a 1-h blood glucose level <155 mg/dl (n = 105), within the cohort shown in panel b (NGT, pre-T2D and T2D groups). e, f, g Single scatter plot representing mean ± SEM percentage of HbA1c (e), OGTT basal glycemia (f) and C-peptide AUC/OGTT AUC ratio (g) measured in quartiles subgroups of IGFBP3 showed in panel b (NGT, pre-T2D, and T2D groups) and established as following: <0.66 (Q1), ranging between 0.66–1.97 (Q2-Q3) and >1.97 (Q4). (h). Line graph comparing insulin-secretion rate measured at different glucose concentrations (4, 5.5, 8, and 11 mM) in Q1 and Q4 IGFBP3 quartiles subgroups shown in panel b (NGT, pre-T2D and T2D groups). i Box plot depicting percent change in peripheral IGFBP3 levels measured in diabetic patients who underwent liver transplantation and who near-normalized (gray) glycometabolic control after transplantation (regressor) or remained diabetic (white, non-regressor). All box plots include the median line, the whiskers indicate the minimum and maximum value and the box of the box plot illustrates the upper and lower quartile (two-sided t test). Demographic characteristics are reported in Supplementary Table 3. j Bar graph representing the percentage of patients with successful islet transplantation (C-peptide >0.4 ng/ml) who displayed low (<1.92, Q1–Q2) vs. high (>1.92, Q3–Q4) peripheral IGFBP3 fold changes. k Bar graph representing TMEM219 mRNA expression by RNAseq in laser-captured islets obtained from human non-diabetic subjects (CTRL, n = 18), individuals with T1D (n = 20), individuals at risk for T1D (AutoAb+, n = 12) and individuals with T2D (n = 8). mRNA expression was expressed as fold change as compared to CTRL. Fold change was computed as the ratio of the changes between T1D, AutoAb+ and T2D values and the CTRL value over the mean CTRL value. Data are expressed as mean ± standard error of the mean (SEM) unless otherwise reported. *P < 0.05; **P < 0.01; ***P < 0.001, ****P < 0.0001 by Kruskal–Wallis adjusted for multiple comparison, Mann–Whitney U test, one-way ANOVA followed by Bonferroni post hoc test, two-way ANOVA, two-sided t test and Chi-square test. Source data are provided as a Source Data file. CTRL healthy volunteers, T1D type 1 diabetes, pre-T1D patients showing positive results for at least one autoantibody, AutoAb autoantibodies, T2D type 2 diabetes, NGT normal glucose tolerance, IGT impaired glucose tolerance, New T1D new-onset T1D, Q quartile, vs versus, qRT-PCR quantitative real-time polymerase chain reaction.

