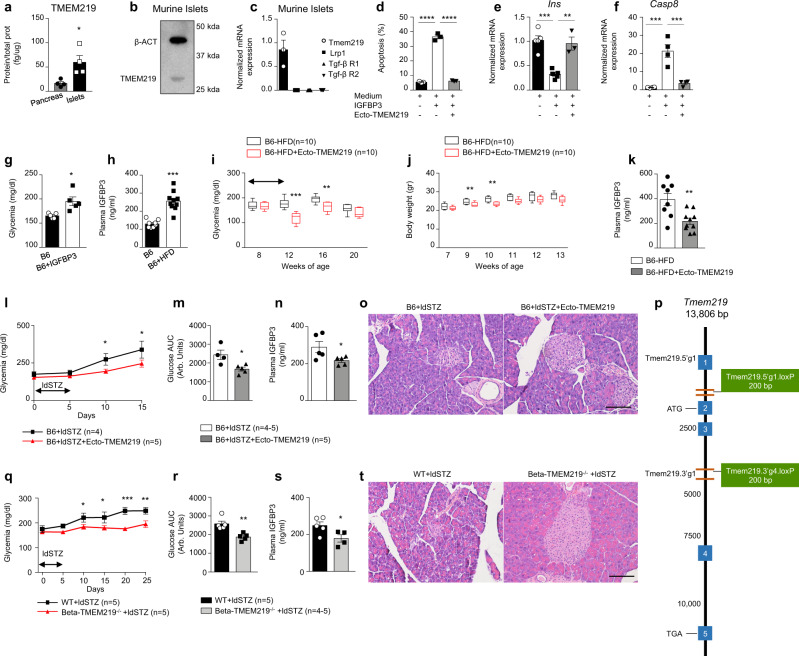
Fig. 4. Targeting IGFBP3/TMEM219 signaling protects beta cells in preclinical models of diabetes in vivo.
a Bar graph showing TMEM219 protein expression (ELISA) assessed in the whole pancreas and dissociated pancreatic islets obtained from B6 mice (n = 4). The experiment was performed in duplicate. b Representative immunoblot of TMEM219 protein expression in murine islets (β-actin was used as a control, n = 3). c Bar graph comparing Tmem219 and other IGFBP3 receptors (Lrp1, Tgf-β R1, and R2) gene expression quantified by qRT-PCR in purified murine islets of B6 mice (n = 3). d Quantitative bar graph (percentage of double-positive cells analyzed per field) depicting apoptosis in purified murine (B6) islets cultured with/without IGFBP3 in the presence or absence of ecto-TMEM219 (n = 3). e, f Bar graphs representing Ins (e) and Casp8 (f) mRNA expression analyzed by qRT-PCR in murine islets cultured with/without IGFBP3 and in the presence or not of ecto-TMEM219 (n = 4 in (f) and n = 5 in (e)). The experiment was performed in duplicate. g Bar graph depicting fasting blood glucose levels measured in IGFBP3-treated and untreated B6 mice (n = 5/group, day 7). (h). Bar graph depicting peripheral IGFBP3 levels measured in plasma obtained from 8-week-old B6 mice fed a high-fat diet (B6-HFD, n = 10) or left untreated (B6, n = 8). i Box plots representing blood glucose levels measured in B6 mice fed a high-fat diet (B6-HFD) treated with (red lines)/without (black lines) ecto-TMEM219 (n = 8–10/group). j Box plots representing body weight measured in B6 mice fed a high-fat diet (B6-HFD) treated with (red dots)/without (black dots) ecto-TMEM219 (n = 8–10/group). In (i) and (j) box plots include the median line, the whiskers indicate the minimum and maximum value, and the box of the box plot illustrates the upper and lower quartile. k Bar graph representing peripheral IGFBP3 levels in ecto-TMEM219-treated and untreated B6-HFD mice (n = 8 and 10, respectively). l Line graph showing blood glucose level measured in B6 mice injected with multiple low-dose of streptozotocin (ldSTZ, 50 mg/Kg) and treated with ecto-TMEM219 or left untreated (n = 5). m Bar graph showing blood glucose area under the curve (AUC) measured at the intraperitoneal glucose (1 g/Kg) tolerance test (IPGTT) in B6 mice injected with multiple low-dose of streptozotocin and treated with ecto-TMEM219 or left untreated at day 10 (n = 5 and 4, respectively). n Bar graph showing IGFP3 plasma levels measured in B6 mice injected with multiple low-dose of streptozotocin and treated with ecto-TMEM219 or left untreated at day 10 (n = 5). o Representative H&E staining in serial pancreatic islet tissue sections obtained from B6 mice injected with multiple low dose of streptozotocin and treated with ecto-TMEM219 or left untreated (n = 3/group). ×20 original magnification, scale bar, 100 μm. p Targeting strategy to generate the TMEM219fl/fl mouse by using the Cre-loxP strategy. q Line graph showing blood glucose level measured in Beta-TMEM219−/− and in wild-type (WT) mice injected with multiple low-dose of streptozotocin (n = 5). r Bar graph showing blood glucose area under the curve (AUC) measured at the IPGTT in Beta-TMEM219−/− and in wild type (WT) mice injected with multiple low-dose of streptozotocin (n = 5). s Bar graph showing IGFP3 plasma levels measured in Beta-TMEM219−/− and in wild-type (WT) mice injected with multiple low doses of streptozotocin (n = 4 and 5, respectively). t Representative H&E staining in serial pancreatic islet tissue sections obtained from WT and Beta-TMEM219−/− injected with multiple low dose of streptozotocin (n = 3/group). ×20 original magnification, scale bar, 100 μm. In (i, j, l, q) statistical analysis compared blood glucose levels or weight expressed as mean ± SEM (l, q) between the two groups at each timepoint. Data are expressed as mean ± standard error of the mean (SEM) unless otherwise reported. *P < 0.05; **P < 0.01; ***P < 0.001; ****P < 0.0001 by one-way ANOVA followed by Bonferroni’s post hoc test, two-way ANOVA, two-sided Mann–Whitney U test or two-sided t test. mRNA expression was normalized to Gapdh. The data shown in o1–o2, t1–t2 are the representative result from three independent experiments. Source data are provided as a Source Data file. B6 C57BL/6J mice, HFD high-fat diet, hyper hyperglycemic, mAb monoclonal antibody, Arb. units arbitrary units, Beta-TMEM219−/− mice in which TMEM219 was deleted in beta cells, WT wild-type mice in which TMEM219 has not been genetically deleted, STZ streptozotocin, ldSTZ low-dose streptozotocin 50 mg/Kg injected for 5 days.

