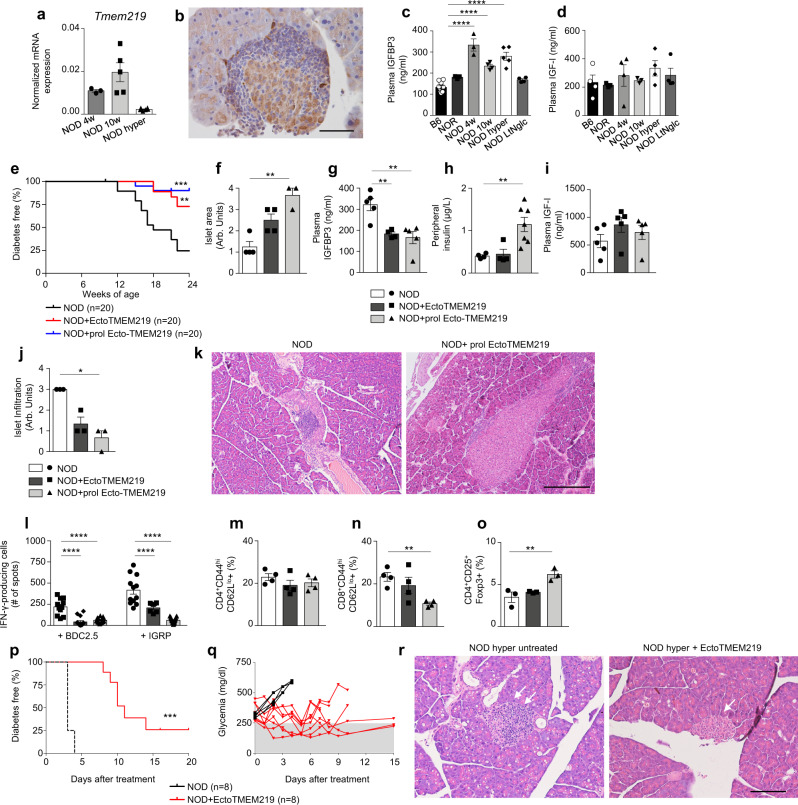
Fig. 5. Targeting IGFBP3/TMEM219 signaling protects beta cells in the NOD mouse in vivo.
a Bar graph depicting Tmem219 mRNA expression analyzed by qRT-PCR in pancreata of NOD mice (n = 3, 5, and 4 per group). b Representative immunohistochemical TMEM219 staining in serial pancreatic islet tissue sections from NOD mice (n = 3). ×40 original magnification, scale bar, 50 μm. c, d Bar graph depicting peripheral IGFBP3 (c) and IGF-I (d) levels measured in plasma obtained from 8-week-old B6 (n = 10) mice, in pre-diabetic (4-week and 10-week-old, n = 4) and diabetic (hyperglycemic, n = 5) NOD mice, in mice resistant to the development of autoimmune diabetes (NOR, n = 3) and in long-term normoglycemic (LtNglc, 26-week-old, n = 4) NOD mice. e Ten-week-old NOD mice were treated with ecto-TMEM219 (0.1 mg/mouse/day for 10 days or 0.1 mg/mouse/day for 10 days and twice per week or were left untreated (n = 20/group), and the incidence of diabetes was then compared using the log-rank (Mantel–Cox) test (**P < 0.01; ***P < 0.001). f Bar graph depicting semi-quantitative analysis of islet area in pancreatic sections obtained from ecto-TMEM219-treated and untreated NOD mice after 14 weeks of treatment (n = 4/group). Data are expressed as a score ranging between 0 and 4. g Bar graph showing reduction of peripheral IGFBP3 levels in ecto-TMEM219-treated and untreated NOD mice after 14 weeks of treatment (n = 5). h Bar graph depicting peripheral insulin levels measured in ecto-TMEM219-treated (n = 4 and 7, respectively) and untreated NOD mice after 14 weeks of treatment (n = 4). i Bar graph showing peripheral IGF-I levels in ecto-TMEM219-treated and untreated NOD mice after 14 weeks of treatment (n = 5). j Bar graph representing islet infiltration detected in pancreatic sections obtained from ecto-TMEM219-treated as compared to untreated NOD mice after 14 weeks of treatment (n = 3/group). Data are expressed as a score ranging between 0 and 4. k Representative H&E staining in serial pancreatic islet tissue sections obtained from 24-week-old NOD mice treated with prolonged ecto-TMEM219 or from untreated mice shown as control (n = 3/group). ×10 original magnification, scale bar, 300 μm. l Bar graph showing IFN-γ-producing cells upon in vitro re-stimulation with BDC2.5 or IGRP peptides detected by ELISpot in ecto-TMEM219-treated as compared to untreated NOD mice after 14 weeks of treatment (n = 10/group, n = 6 in the short course ecto-TMEM219-treated group). m, n, o Bar graphs representing the percentage of CD4+CD44hiCD62Llo (n = 4/group), CD8+CD44hiCD62Llo (n = 4/group), and CD4+CD25+Foxp3+ cells (n = 3/group) detected in splenocytes of ecto-TMEM219-treated as compared to untreated NOD mice after 14 weeks of treatment. p, q Newly hyperglycemic NOD mice were treated with Ecto-TMEM219 or were left untreated and the incidence of diabetes was then compared using the log-rank (Mantel–Cox) test (***P < 0.001). r Representative H&E staining in serial pancreatic islet tissue sections obtained from newly hyperglycemic NOD mice, treated with ecto-TMEM219 or from untreated mice shown as control (n = 3/group). ×20 original magnification, scale bar, 100 μm. Data are expressed as mean ± standard error of the mean (SEM) unless otherwise reported. *P < 0.05; **P < 0.01; ***P < 0.001; ****P < 0.0001 by one-way ANOVA followed by Bonferroni’s post hoc test, log-rank Mantel–Cox test, Kruskal–Wallis test adjusted for multiple comparisons. mRNA expression was normalized to Gapdh. The data shown in (b), k1–k2, r1–r2 are the representative result from three independent experiments. Source data are provided as a Source Data file. NOD nonobese diabetic mice, LtNglt long-term normoglycemic NOD mice, NOR nonobese diabetes-resistant mice, hyper hyperglycemic, mAb monoclonal antibody, Arb. units arbitrary units.

