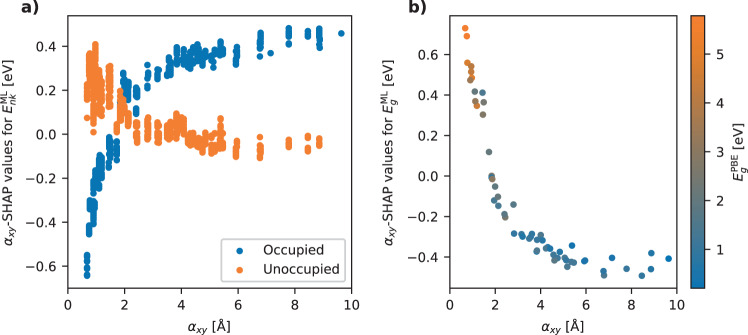
Fig. 9. SHAP analysis.
a SHAP values for αxy for the prediction of GW correction energies color-coded by occupancy. For materials with a low polarisability, the ML model predicts a more negative GW correction for the occupied states and a more positive correction for the unoccupied states. For materials with a high polarisability, the occupied states are predicted with a more positive correction when using the polarisability as a feature while the unoccupied states are only weakly affected. b SHAP values for αxy for the prediction of bandgaps. This shows that the bandgap increases for materials with a low αxy and decreases for high αxy values.

