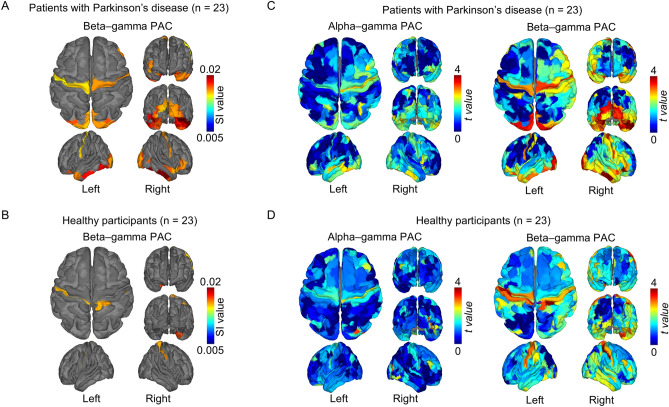
Figure 1.
Beta–gamma phase-amplitude coupling during the resting state. For each study group (patients with Parkinson’s disease and healthy study participants), we averaged synchronization index (SI) values for beta–gamma coupling and color-coded them on the cortex of (A) patients (n = 23) and (B) healthy participants (n = 23). The SI values are shown only if they significantly exceeded the corresponding phase-shuffled values in (A) and (B). The t values between SI values and phase-shuffled SI values are color-coded on the cortex of (C) patients (n = 23) and (D) healthy participants (n = 23) for alpha–gamma coupling and beta–gamma coupling.

