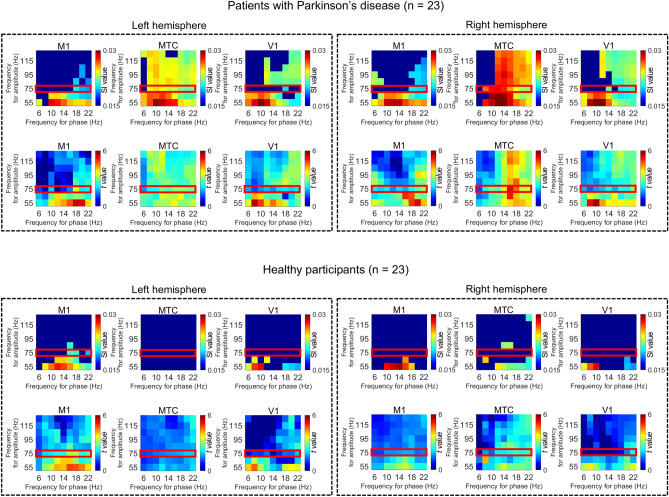
Figure 3.
Phase–amplitude coupling at representative cortical areas. The synchronization index (SI) values for various combinations of frequency bands were calculated at cortical vertices belonging to representative cortical areas and averaged for each cortical area. The primary motor cortex (M1, Human Connectome Project [HCP] parcel #8), the anterior middle temporal cortex (MTC, HCP parcel #134), and the primary visual cortex (V1, HCP parcel #1) of both hemispheres were selected as representative cortical areas. The SI values were averaged for each participant group, and only SI values that significantly exceeded the phase-shuffled SI values were plotted (P < 0.05, 2-tailed paired Welch t test, false discovery rate corrected). Each phase has a 4 Hz frequency range (that is, “6 Hz” in frequency for phase corresponds to “4–8 Hz”), and each amplitude has a 50 Hz frequency range (that is, “55 Hz” in frequency for amplitude corresponds to “30–80 Hz”). The corresponding t values are shown below each of the SI values. The red squares indicate the SI values for gamma amplitude (50–100 Hz).

