Figure 2.
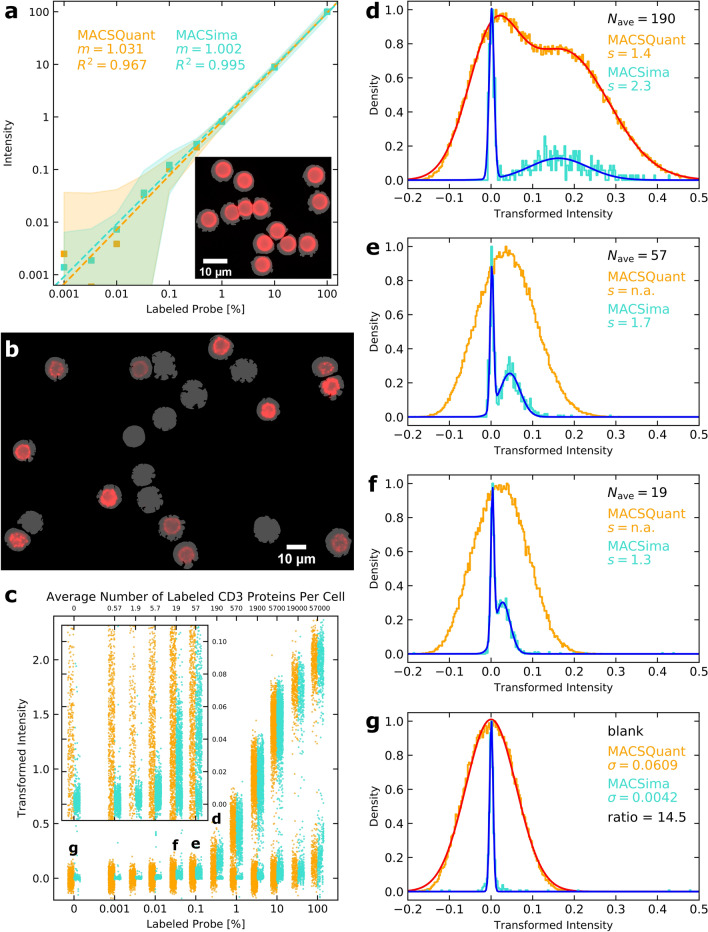
Comparison of linearity and sensitivity of imaging-based cytometry on the MACSima System with flow cytometry on the MACSQuant Analyzer. (a) Means (square symbols) and ± 1σ ranges (shaded regions) describing the population distributions for beads incubated with different percentages of APC-labeled vs. unlabeled antibodies measured by the MACSQuant Analyzer (orange) and MACSima Imaging System (cyan). For the images (see inset), bead autofluorescence in the DAPI channel was used to create individual bead masks (gray) over which the total background-subtracted APC signal could be determined. Least-squares line fits on the log–log axes are shown (dashed lines), with the optimal slopes, m, and corresponding R2 values listed for each dataset. (b) Image of PFA-fixed PBMCs labeled with a CD3-APC antibody (red) and a CD45-VioBlue antibody, with the latter staining used to generate the displayed masks (gray) for each CD45+ cell. (c) CD45+ PBMCs were assessed for their CD3-APC co-staining for different stoichiometric amounts of an APC-labeled vs. unlabeled CD3 antibody on the MACSQuant Analyzer (orange) and MACSima Imaging System (cyan). The upper x-axis displays the approximate average number of labeled CD3 proteins per CD3+ cell for each assayed percentage, based on the previously measured26 average copy number of CD3 per cell amounting to 57,000. Only a small representative subset of the full MACSQuant Analyzer data (the latter ranging from 54,581 to 167,637 cells) is displayed for each assayed percentage of labeled probe to match the respective number of cells measured by the MACSima Imaging System (ranging from 417 to 2384 cells). The inset gives a zoomed-in view of the y-axis for better visualization of the scatter plot distributions. (d–g) Histograms for specific assayed percentages of labeled probe are shown based on the complete datasets from both instruments. For Nave = 190 (d), the CD3+ cell population is recognizable in both datasets as a second peak, permitting a double Gaussian fit and consequent determination of the separation parameter, . For Nave = 57 (e) and Nave = 19 (f), a second peak is only distinguishable in the MACSima Imaging System’s dataset. The width of the distribution for the blank (g) provides a useful estimate of the measurement error expected for weak signals on both instruments.

