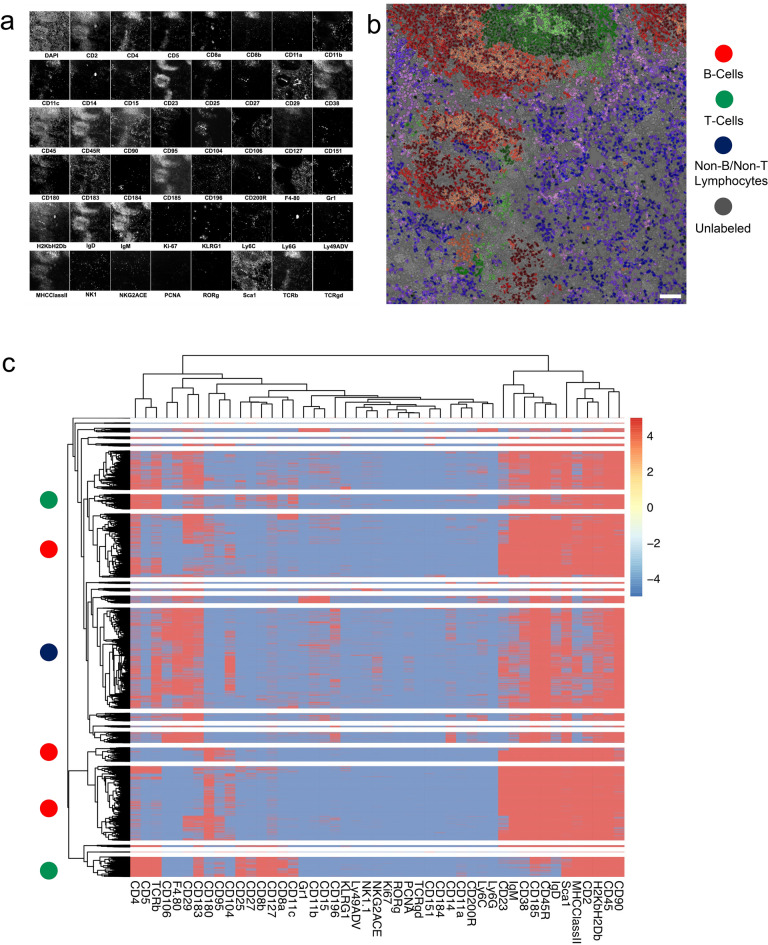
Figure 3.
Multi-channel analysis of a mouse spleen section on the MACSima Imaging System. A mouse spleen section was fixed by acetone and subsequently stained by directly fluorescently labeled antibodies in subsequent cycles. DAPI was used to stain the nuclei in the section, and it was used to register the images across the cycles and to segment the nuclei of the cells in the section. (a) Small images of each of the channels used to generate the more complex data visualizations in the subsequent panels. In total, 47 antibody staining images and one DAPI image are shown. (b) Result of an extensive k-means (40 clusters) clustering of the staining intensity values of cells after segmentation is shown, in which four cell populations are colored, with B cells in red, T cells in green, Non-B/Non-T cells in blue, and cells not recognized by the antibody panel in gray (17 clusters). The different color changes within the red (9 clusters), green (7 clusters) and blue (17 clusters) represent distinct subpopulations within the respective groups. (c) Results of hierarchical clustering (20 clusters) based on the mean staining intensity values of individual cells and a marker expression heat map of the various subpopulations. On the left side a colored dot inticates if a cluster consists mainly of cell types as classified in b, namely B or T cells or non-B/non-T cells.

