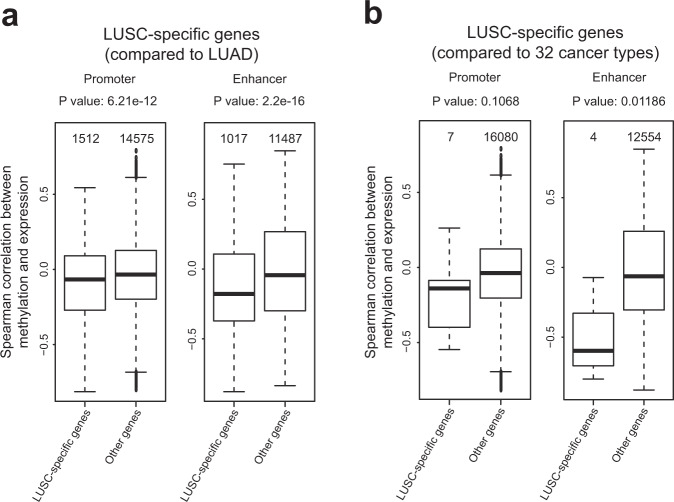
Fig. 2. Correlation analysis of methylation with lung squamous cell carcinoma (LUSC)-specific gene expression.
a The box plot shows the correlation of methylation with the expression of LUSC-specific genes (compared to TCGA-LUAD) vs. all other genes. b The box plot shows the correlation of methylation with the expression of LUSC-specific genes (compared to 32 TCGA cancer types and normal tissue of LUSC) vs. all other genes. Significance was assessed with a two-sided Wilcoxon signed-rank test. Box plots show the median, first and third quartiles, and outliers.

