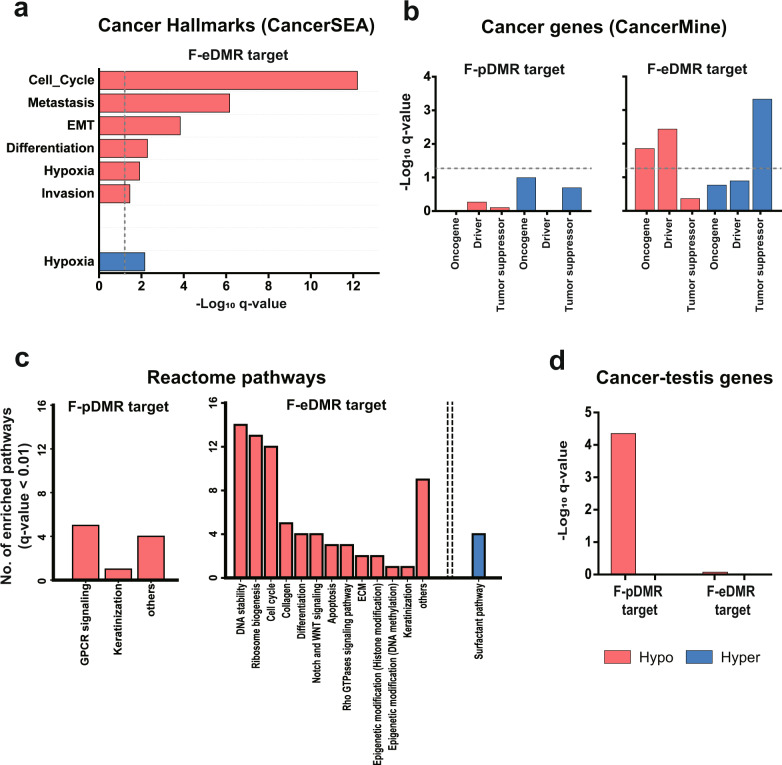
Fig. 3. Gene set enrichment analysis for target genes of promoter differentially methylated regions (pDMRs) and enhancer differentially methylated regions (eDMRs).
a Enrichment of cancer hallmark gene sets from the CancerSEA database for functional (F)-eDMR target genes. The dashed line indicates the significance threshold (q-value < 0.05). b Enrichment of each category of cancer-associated genes from the CancerMine database for F-pDMR and F-eDMR target genes. The dashed line indicates the significance threshold (q-value < 0.05). c Enrichment of Reactome pathway gene sets for F-pDMR and F-eDMR target genes. The bar graph indicates the number of significantly enriched pathways (q-value < 0.01) for each category. d Enrichment of cancer-testis genes for F-pDMR and F-eDMR target genes.

