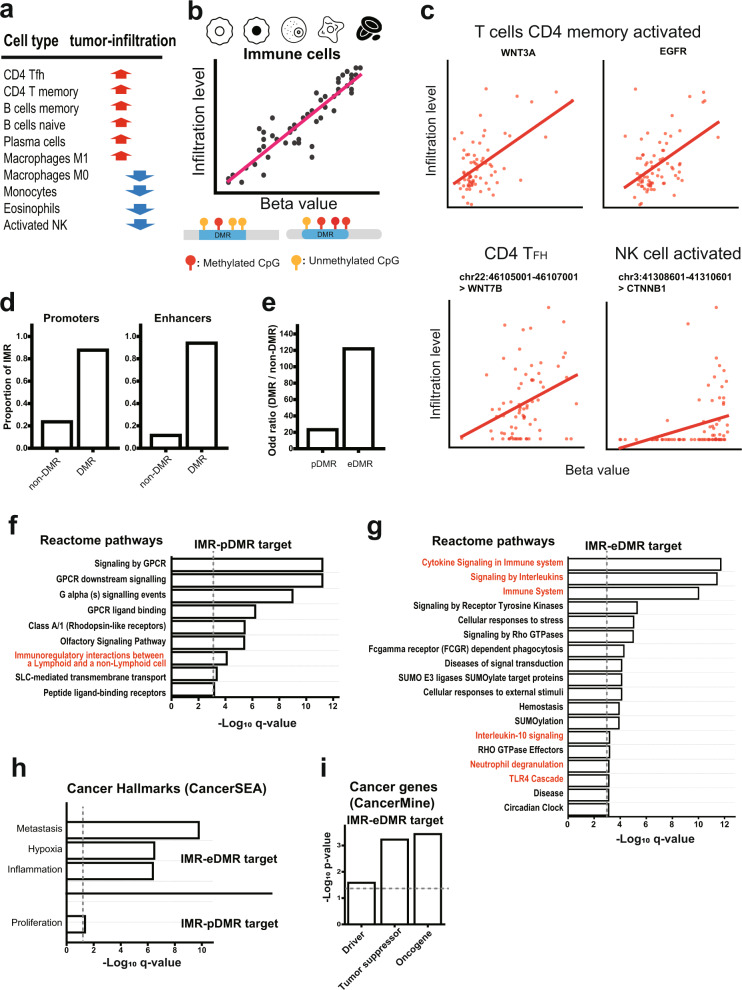
Fig. 5. Regulation of immune infiltration by DNA methylation.
a Ten immune cell types that showed abundance changes in tumors. b Schematic overview to define infiltration-associated methylation regions (IMRs) using correlation analysis between methylation and immune cell infiltration (q-value < 0.01, Spearman’s correlation). c Examples of promoters and enhancers whose methylation level correlates with immune cell infiltration. d Proportion of IMRs among differentially methylated regions (DMRs) vs. non-DMRs. e Odds ratio of DMRs to non-DMRs among IMRs. f, g Reactome pathway gene sets significantly enriched for genes regulated by IMR-pDMRs (f) or by IMR-eDMRs (g) outside partially methylated domains (PMDs) (only those with q-value < 0.001 are presented in the plot). The dashed line indicates the significance threshold (q-value < 0.001) for the presented bar plots. h Enrichment of cancer hallmark gene sets from the CancerSEA database for the genes regulated by IMR-eDMRs or IMR-pDMRs outside PMDs. The dashed line indicates the significance threshold (q-value < 0.05). i Enrichment of each category of cancer-associated genes from the CancerMine database for the genes regulated by IMR-eDMRs outside PMDs. The dashed line indicates the significance threshold (p-value < 0.05).

