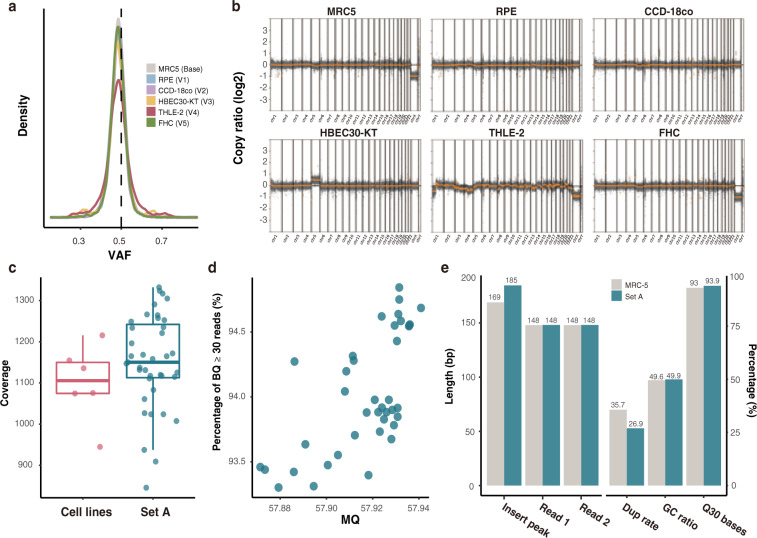
Fig. 2.
Quality validation for materials and sequencing data. (a) Distribution of heterozygous SNPs of the six cell lines. (b) Copy number ratio of the six cell lines. (c) Sequence coverage of the 6 cell lines and 39 mixtures of Set A. (d) Distribution of mean MQ and the percentage of bases with BQ over 30 in Set A. (e) Comparison of the read features between WES data of MRC-5 and mean values of 39 Set A. The lengths of insert size peak, paired read 1, paired read 2 and the percentages of PCR duplication rate (Dup rate), GC ratio, proportion of high-quality bases (BQ30) were compared. SNP single nucleotide polymorphism, MQ mapping quality, BQ base quality, WES whole exome sequencing.

