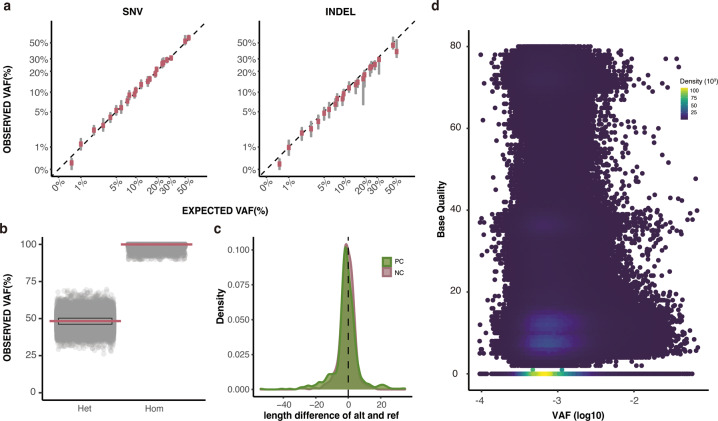
Fig. 3.
Quality validation of positive and negative controls. (a) Correlations of expected and observed VAF of positive SNVs (r = 0.97, p < 2.2e-16) and INDELs (r = 0.90, p < 2.2e-16) are shown in log 10 scale. Red lines: median VAF of observed VAFs. (b) VAF distributions of germline negative controls. (c) Length difference between alternative allele and reference allele of PC INDELs and NC germline INDELs. (d) Base qualities and log 10 transformed VAFs of artifacts in chromosome 1 of the random sample M2-5. The density of qualitative and quantitative distribution of artifacts were calculated from unexpected alternative alleles in Set A non-variant negative controls and depicted using ggpointdensity. VAF variant allele frequency, Het heterozygous, Hom homozygous, PC positive control, NC negative control.

