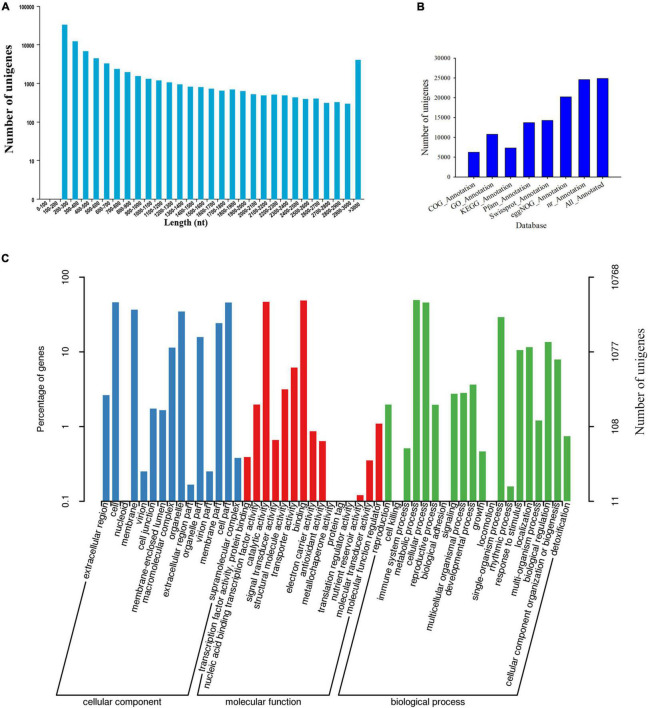
FIGURE 1.
Information of de novo assembled unigenes in C. sinense gleaned from transcriptomic analysis. (A) Length distribution of de novo assembled unigenes. (B) Annotation of unigenes against seven public databases (COG, GO, KEGG, Pfam, Swissprot, eggNOG, and nr). (C) GO functional classification (three subcategories) of the unigenes. The left Y-axis refers to the percentage of a specific category of target genes in that main category, while the right Y-axis refers to the number of target genes expressed in each subcategory.

