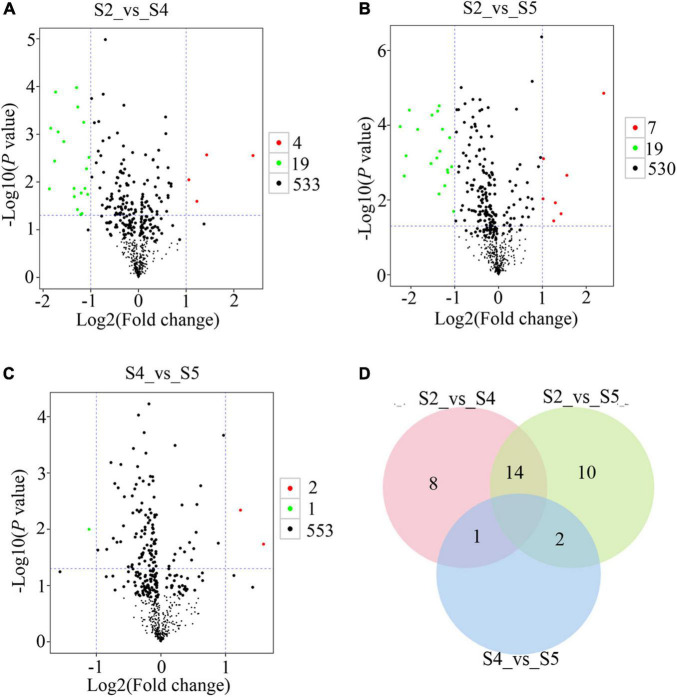
FIGURE 5.
Metabolomic GC-TOF-MS-based analyses of the C. sinense ovule at three developmental stages (S2, S4 and S5). Visualization, using volcano plots, of the identified metabolites from S2_vs_S4 (A), S2_vs_S5 (B), and S4_vs_S5 (C) comparisons. Green dots in the graph represent down-regulated DAMs, red dots represent up-regulated DAMs, and black represents metabolites that were detected but were not significantly different. (D) Venn diagram for the number of unique and overlapping DAMs from S2_vs_S4, S2_vs_S5 and S4_vs_S5 comparisons.

