Figure 3.

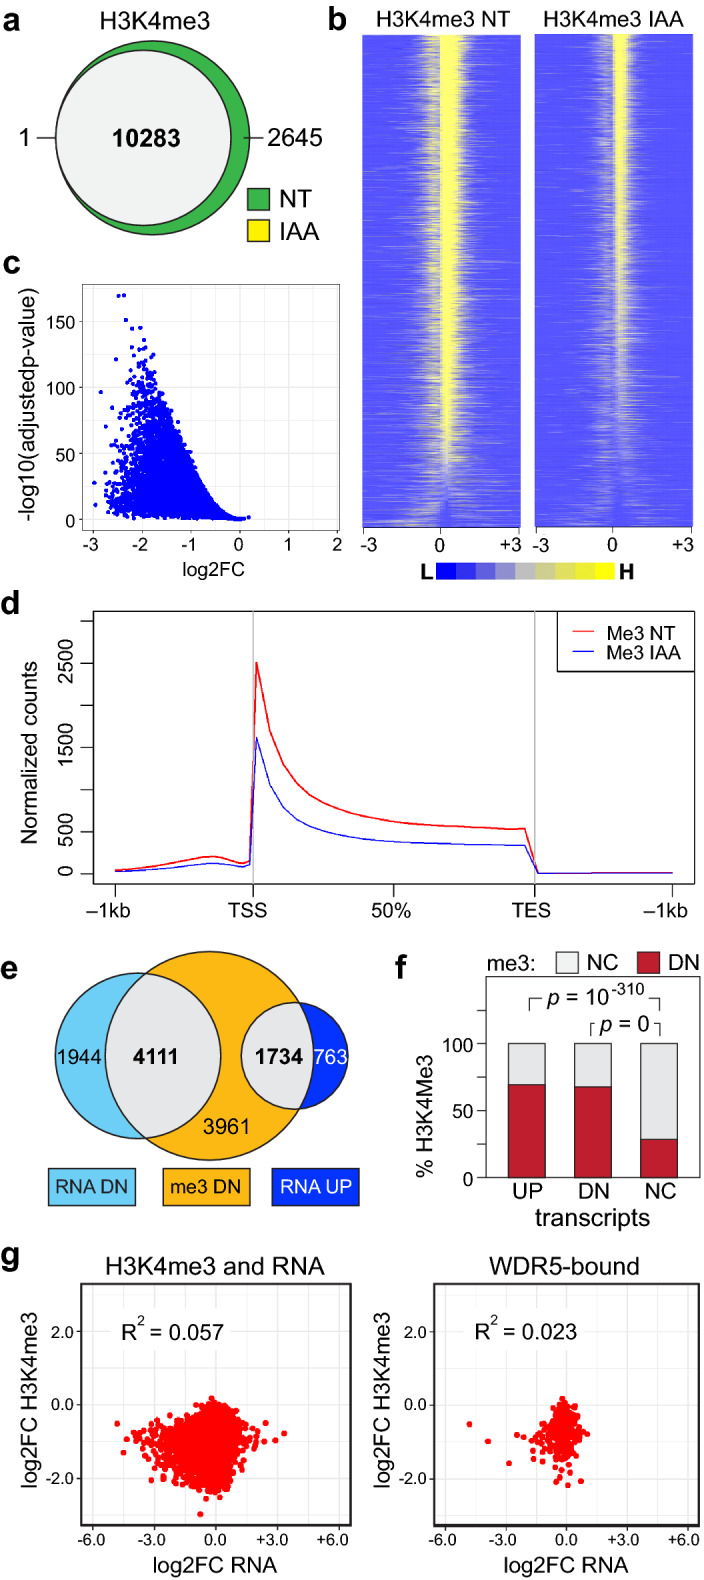
Impact of WDR5 degradation on chromatin-associated H3K4me3. (a) Venn diagram, displaying the overlap of H3K4me3 ChIP-Seq peaks in non-treated (NT) or treated (18 h/100 μM IAA) AIDW cells. N = 3 for each set. (b) Heatmaps of the average normalized peak intensity (100 bp bins) for H3K4me3 peaks in NT and IAA-treated AIDW cells. Peaks are ranked according to the NT sample. Included are regions 3 kb upstream (− 3) and downstream (+ 3) of the peak zenith (0). (c) Volcano plot, comparing the log2FC in H3K4me3 peak intensity (IAA versus NT) against the − log10(adjusted p-value). (d) Averaged H3K4me3 peak shape and distribution in NT and IAA-treated AIDW cells, relative to the transcription start site (TSS), the transcription end site (TES), and 1 kb upstream and downstream of each. (e) Venn diagram, displaying the relationship between genes with decreased H3K4me3 and transcripts displaying significant decreases or increases in IAA-treated versus NT cells. (f) Graph showing the percentage of genes with not changed (NC; gray) or decreased (DN; red) H3K4me3 (me3) levels in IAA-treated cells, binned according to whether transcripts for those genes are increased (UP), decreased (DN), or not changed (NC) by IAA-treatment in RNA-Seq. p-values for UP against NC and DN against NC are shown; the p-value for UP against DN is 0.1738. (g) Scatter plots comparing log2FC in H3K4me3 versus RNA for IAA-treated AIDW cells. Comparisons are for (left) all genes that have a measurable H3K4me3 peak and a measurable transcript, and (right) genes that are bound by WDR5 in Ramos cells4 and have measurable H3K4me3 and RNA signals. The coefficient of determination (R2) is shown inside each plot.
