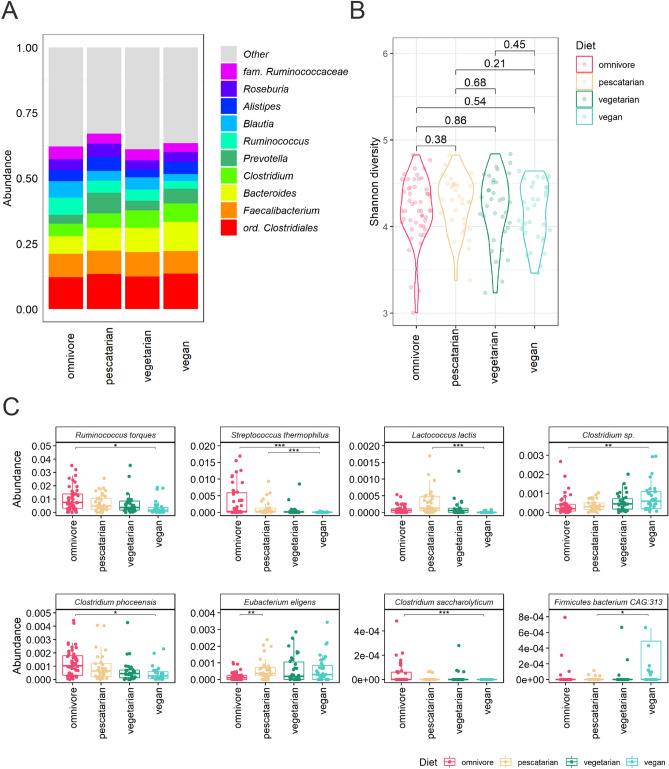
Figure 1.
Association of dietary habits and the gut microbiome composition. (A) Relative abundance of the 10 most abundant bacterial genera per diet group. (B) Alpha diversity per diet group expressed by Shannon index. Differences in alpha diversity between diet groups were compared using Wilcoxon rank-sum tests. (C) ANCOM-BC analysis for differential relative abundance of bacterial species between diet groups. Abundance was plotted on the relative abundance scale from 0.00 to 1.00. Adjusted p values are indicated by *< 0.05, **< 0.01 and ***< 0.001.

