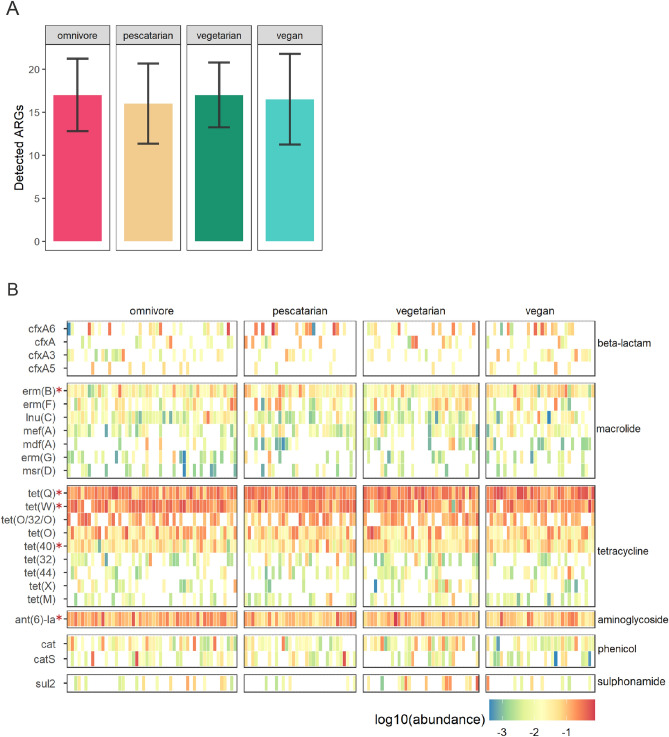
Figure 2.
Antibiotic resistance gene distribution in the gut resistome through metagenomic shotgun sequencing. (A) Average number and standard deviation of antibiotic resistance genes (ARGs) detected in each diet group. (B) Heatmap depicting ARGs abundance per participant. Each column denotes a study participant, clustered per diet group. Rows represent the relative abundance of ARG classes. ARGs present at least in 10% of the participants are shown. ARGs present in the resistome of at least 95% of the participants are indicated by the asterisks.

