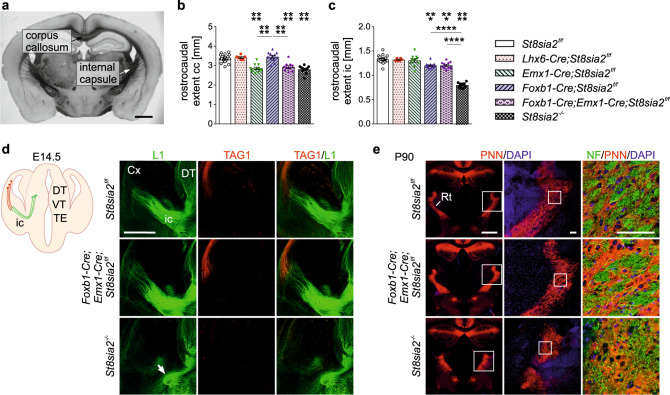
Fig. 1. Deficits of thalamus-cortex connectivity in St8sia2−/− mice are not reproduced by any of the cKO lines.
a Representative image showing the corpus callosum and the internal capsule on a coronal brain section from a St8sia2f/f mouse. b, c Rostrocaudal extent of the corpus callosum (cc) and the internal capsule (ic) for the indicated genotypes. Graphs show means ± SEM and individual data points of n = 24, 6, 11, 12, 11, and 11 St8sia2f/f, Lhx6-Cre;St8sia2f/f, Emx1-Cre;St8sia2f/f, Foxb1-Cre;St8sia2f/f, Foxb1-Cre;Emx1-Cre;St8sia2f/f and St8sia2−/− mice, respectively. One-way ANOVA indicated significant differences (p < 0.0001; F5,69 = 27.28 in b, F5,69 = 88.33 in c). Holm–Sidak’s post hoc tests were applied and significant differences for comparisons with St8sia2f/f controls or between selected genotype groups are indicated (***p < 0.001, ****p < 0.0001). d Scheme of thalamocortical (green) and corticothalamic axons (red), and immunolabelling with L1- (green) and TAG1-specific antibodies (red) on coronal sections of brains from embryonic day (E) 14.5 mice of the indicated genotypes (DT, dorsal thalamus; VT, ventral thalamus; TE, thalamic eminence; ic, internal capsule). The white arrow points to deviating thalamocortical axons in the St8sia2−/− embryo. e Labeling of perineuronal nets with Wisteria floribunda agglutinin (PNN, red) to visualize the reticular thalamic nucleus (Rt), and neurofilament staining of fibers (NF, green) on coronal sections of brains from P90 mice of the indicated genotypes. Boxed areas highlight higher magnification views in the following column. Scale bars, 1 mm in (a) and (e), left column, 500 μm in (d), 100 μm in (e), middle and right column.

