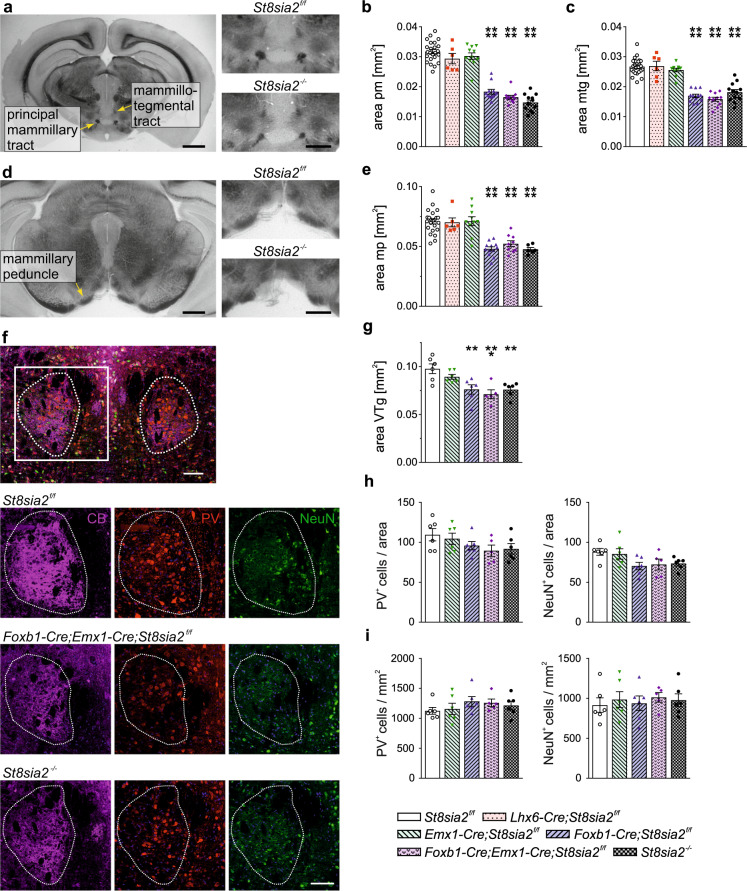
Fig. 3. Ablation of St8sia2 by Foxb1-Cre affects tegmental connectivity of the MB.
a–e Representative images of crossections (a, d) and evaluations of crossectional areas of the principle mammillary tract (pm, b) and the mammillotegmental tract (mtg, c) at bregma −2.70 mm, and the mammillary peduncle (mp) at bregma −3.28 (e). Scale bars, 1 mm (overviews) and 500 µm (higher magnifications). Graphs show means ± SEM and individual data points of n = 24, 6, 11, 12, 11 and 12 (b, c) or n = 23, 6, 10, 12, 9, and 6 (e) St8sia2f/f, Lhx6-Cre;St8sia2f/f, Emx1-Cre;St8sia2f/f, Foxb1-Cre;St8sia2f/f, Foxb1-Cre;Emx1-Cre;St8sia2f/f, and St8sia2−/− mice, respectively. One-way ANOVA indicated significant differences (p < 0.0001; F5,70 = 82.54 in b, F5,73 = 48.90 in c, F5,60 = 19.24 in e). Holm–Sidak’s post hoc tests were applied and significant differences for comparisons with St8sia2f/f controls are indicated (****p < 0.0001). f Triple immunofluorescent staining for calbindin (CB, magenta), parvalbumin (PV, red), and NeuN (green) of the ventral tegmantal nuclei (VTg, dotted outline) on coronal sections of brains from P90 mice at bregma level −4.90 mm. Overview (upper panel) and representative single channel views of the indicated genotypes. Scale bars, 100 µm. g–i Evaluation of the crossectional area of the VTg (g), the numbers (h) and the densities (i) of PV- and CB-positive cells in the crossectional area of the VTg. Graphs show means ± SEM and individual data points of n = 5 Foxb1-Cre;Emx1-Cre;St8sia2f/f mice or n = 6 St8sia2f/f, Emx1-Cre;St8sia2f/f, Foxb1-Cre;St8sia2f/f, and St8sia2−/− mice, respectively. One-way ANOVA indicated significant differences with p = 0.0007 for the areas in (g) (F4,24 = 6.992), but not for the numbers or densities of PV- and CB-positive neurons in (h) and (i) (p = 0.22, F4,24 = 1.55 and p = 0.059, F4,24 = 2.630 for PV and NeuN in h; p = 0.94, F4,24 = 0.19 and p = 0.55, F4,24 = 0.79 for PV and NeuN in i). Holm–Sidak’s post hoc test was applied for data in (g) and significant differences for comparisons with St8sia2f/f controls are indicated (**p < 0.01, ***p < 0.001). When compared to Emx1-Cre;St8sia2f/f, differences with p < 0.05 were only observed for Foxb1-Cre;Emx1-Cre;St8sia2f/f.

