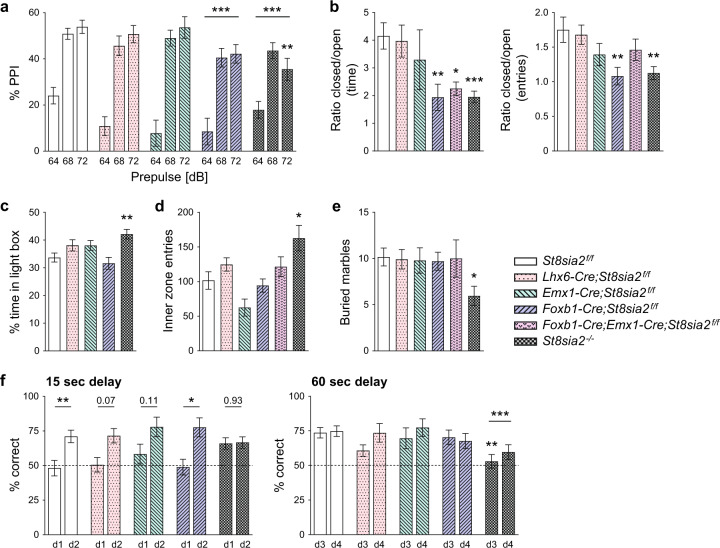
Fig. 5. Ablation of St8sia2 by Foxb1-Cre impairs PPI and reduces anxiety in the elevated plus maze, but has no effect in other tests of anxiety-like behavior or on working memory.
a PPI of the acoustic startle response after prepulses of 64, 68, and 72 dB in mice treated with 5 mg/kg apomorphine. Graphs show means ± SEM of n = 37, 18, 17, 18, and 27 St8sia2f/f, Lhx6-Cre;St8sia2f/f, Emx1-Cre;St8sia2f/f, Foxb1-Cre;St8sia2f/f, and St8sia2−/− mice, respectively. b Elevated plus maze. Ratios between the time spent in the closed versus the open arm of the elevated plus maze (left), and between the numbers of closed and open arm entries (right). Graphs show means ± SEM of n = 15, 23, 6, 17, 5, and 21 (left) or n = 16, 24, 6, 19, 6, and 22 (right) St8sia2f/f, Lhx6-Cre;St8sia2f/f, Emx1-Cre;St8sia2f/f, Foxb1-Cre;St8sia2f/f, Foxb1-Cre;Emx1-Cre;St8sia2f/f, and St8sia2−/− mice, respectively. c–e Percent of time spent in the light compartment of a dark-light box (c), number of entries into the inner zone of the open field (d, experienced mice, see Fig. 4c) and number of marbles buried in the marble burying test (e). Graphs show means ± SEM of n = 16, 20, 17, 15, and 18 St8sia2f/f, Lhx6-Cre;St8sia2f/f, Emx1-Cre;St8sia2f/f, Foxb1-Cre;St8sia2f/f, and St8sia2−/− mice (c), or n = 12, 10, 5, 16, 14, and 17 (d) and n = 23, 24, 18, 23, 9, and 20 (e) St8sia2f/f, Lhx6-Cre;St8sia2f/f, Emx1-Cre;St8sia2f/f, Foxb1-Cre;St8sia2f/f, Foxb1-Cre;Emx1-Cre;St8sia2f/f, and St8sia2−/− mice, respectively. f Delayed nonmatch-to-place T-maze task. Percent correct choices (arm alterations) of mice tested on day 1 and 2 (d1, d2) with a forced delay of 15 s (left) and on day 3 and 4 (d3, d4) with a forced delay of 60 s (right). Graphs show means ± SEM of n = 32 or n = 37 St8sia2f/f controls for the tests with 15 or 60 s delay, and n = 17, 14, 16, and 25 Lhx6-Cre;St8sia2f/f, Emx1-Cre;St8sia2f/f, Foxb1-Cre;St8sia2f/f, and St8sia2−/− mice, respectively. Statistics: In a, two-way ANOVA indicated no significant interaction (p = 0.059, F8,336 = 1.90), but differences with p < 0.0001 for prepulse (F2,336 = 105.0) and p = 0.0003 for genotype (F4,336 = 5.53). In b, genotype comparisons for “time” were performed by Welch’s ANOVA after square root transformation, to meet the assumption of normal distribution (left), or by one-way ANOVA (right), indicating differences with p = 0.003 (W5.0,25.13 = 5.01) or p = 0.001 (F5,87 = 4.38). In c, d, and e, one-way ANOVA indicated differences with p = 0.003 (F4,81 = 4.58), p = 0.001 (F5,68 = 4.60), and p = 0.086 (F5,111 = 1.99). In f, two-way RM ANOVA indicated for the 15 s delay test no significant interaction (p = 0.14, F4,99 = 1.77), no difference for genotype (p = 0.41, F4,99 = 1.01), but differences with p < 0.0001 for day (F1,99 = 22.4), and for the 60 s delay test no significant interaction (p = 0.67, F4,104 = 0.59), no difference for day (p = 0.13, F4,104 = 2.27), but differences with p = 0.002 for genotype (F4,104 = 4.65). In a and f (right panel), Holm–Sidak’s multiple comparisons tests were used to analyze main effects of genotype. Dunnet’s T3 or Holm–Sidak’s multiple comparisons tests were applied to analyze simple effects of genotype after Welch’s ANOVA in (b) (left) or after one- or two-way ANOVA in (a), (b) (right), and (c–f). In f, Holm–Sidak’s post hoc tests were applied for comparisons between d1 and d2. p-values for comparisons between d1 and d2 (f, left) or significant differences for comparisons with St8sia2f/f controls are indicated (*p < 0.05, **p < 0.01, ***p < 0.001).

