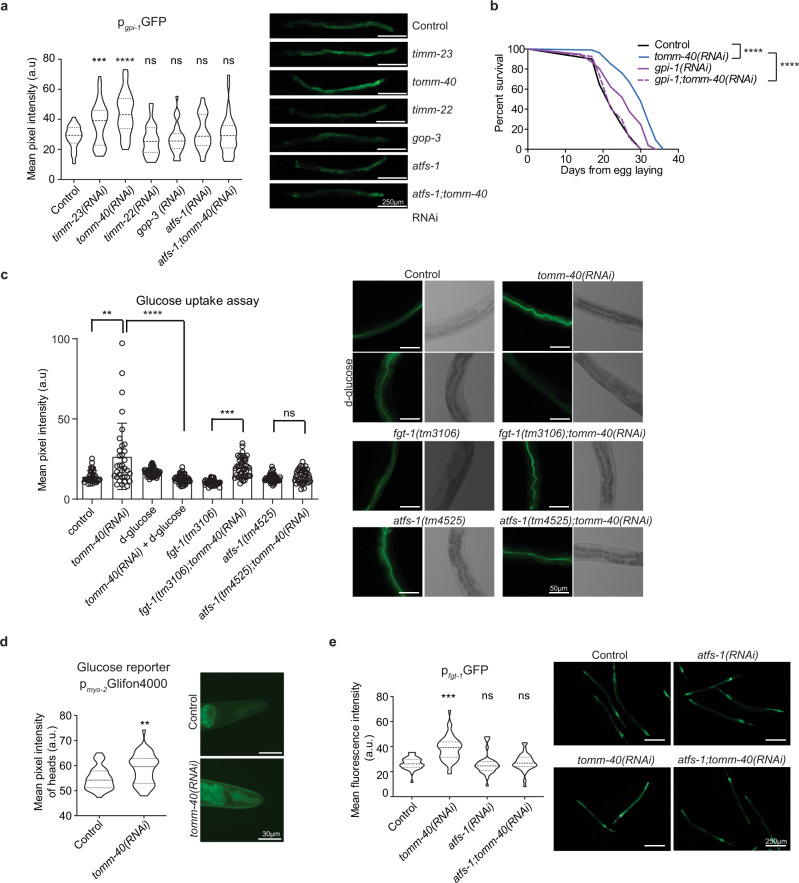
Fig. 4. MitoMISS-induced longevity requires both glucose uptake and glycolysis in an ATFS-1-dependent manner.
a Expression levels of the glycolysis transcriptional reporter, gpi-1, upon inhibition of the mitochondrial protein import components, timm-23, tomm-40, timm-22 and gop-3. n = 3 biologically independent experiments with at least 20 worms per condition. All conditions were compared to control with two-tailed t-test. b Lifespan curves of wild type animals in gpi-1 deficient animals and upon MitoMISS. n = 3 biologically independent experiments. Lifespan curves were statistically analyzed with the Log-rank (Mantel–Cox) test. c Glucose uptake assay, using the fluorescent glucose analog 2-NBDG, upon MitoMISS. n = 3 biologically independent experiments with at least 20 worms per condition. Two-tailed t-test was used for comparisons. Data presented as mean ± SEM. d In vivo imaging of glucose levels of animals expressing Glifon4000 under the myo-2 promoter upon MitoMISS. Fluorescence data depicted in violin plot. n = 2 biologically independent experiment. Comparison with two-tailed t-test. e Expression levels of the transcriptional reporter of glucose transporter fgt-1 upon MitoMISS. Data depicted in violin plot. Fluorescent intensity of each sample was compared to the control with a two-tailed t-test. (**** denotes P < 0.0001, *** denotes P < 0.001,** denotes P < 0.01 and * denotes P < 0.05). Exact sample size and P values are included in the Source Data file. a.u. arbitrary units.

