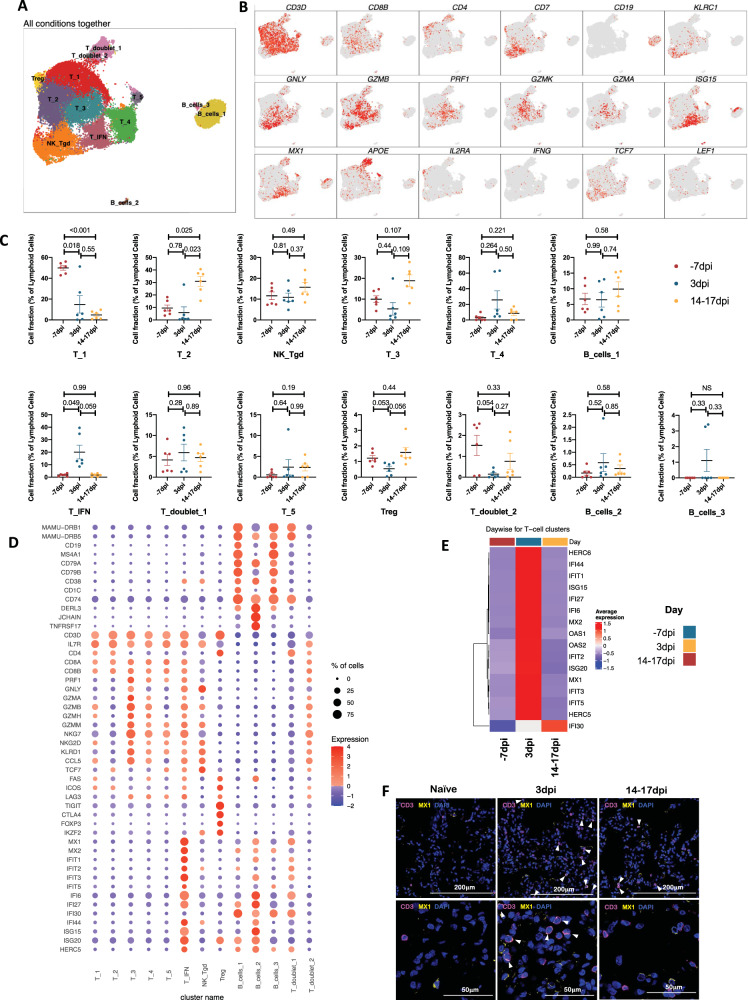
Fig. 7. Lymphoid single-cell landscape in SARS-CoV-2 infected macaques.
BAL lymphoid cell dynamics in macaques infected with SARS-CoV-2 by scRNA-seq demonstrate the presence of IFN responsive T cells. A UMAP plot of lymphoid cells from all scRNA-seq samples together, colored according to cluster classification. B UMAP plots with the expression of markers, characterizing main lymphoid populations in macaques. C Cell proportion of each cluster per condition. n = 6 macaques. Data are presented as mean ± standard error of the mean (SEM). Source data are provided as a source data file. D Bubble plot showing the fold change of genes in identified lymphoid cell clusters and the fraction of cells expressing the gene of interest. E Heatmap of key interferon responsive genes at different timepoints in lymphoid sub-clusters. F Multilabel immunofluorescence confocal images validating in vivo expression of MX1 (yellow) in T-cells marked by CD3 (magenta) and nuclei (blue) in Naive as well as SARS CoV-2 infected lungs at 3 dpi and 14–17 dpi. White arrows represent T cells expressing MX1.

