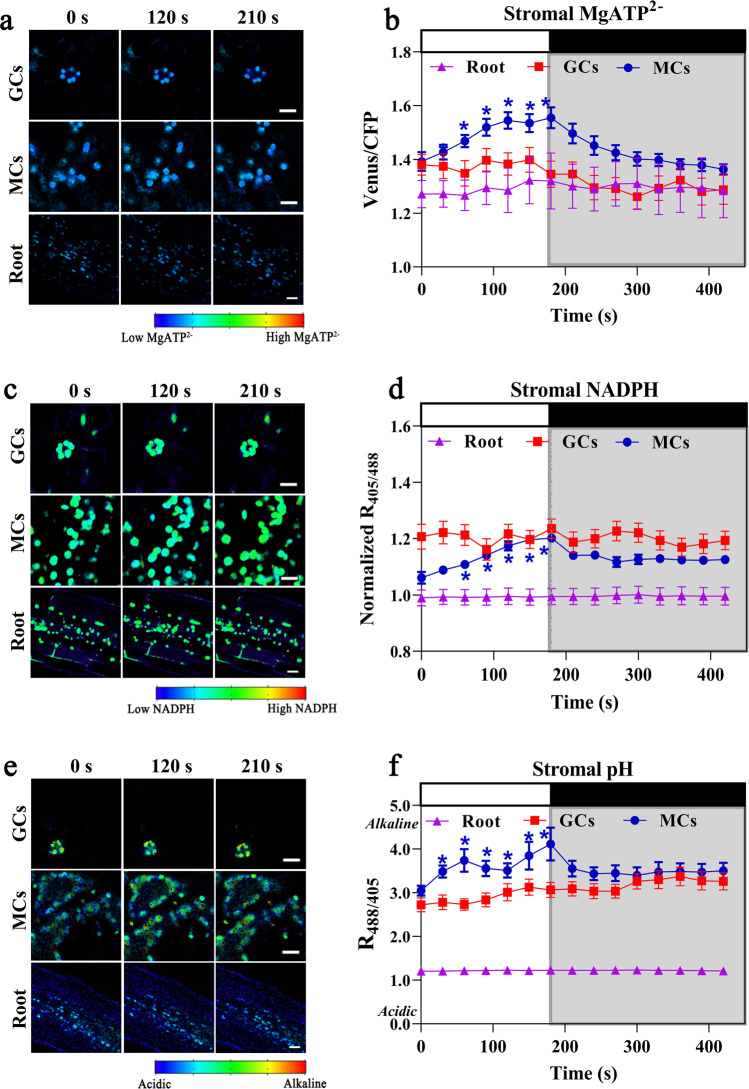
Fig. 2. Real-time light responses of stromal MgATP2–, NADPH and pH sensors in 21-day-old plants.
The ratiometric shifts of a, b MgATP2– sensor AT1.03 (p-values of panel b: 0 s vs. 60 s = 0.007, 0 s vs. 90 s = 0.001, 0 s vs. 120 s = 2.5 × 10⁻⁴, 0 s vs. 150 s = 1.9 × 10⁻⁴, and 0 s vs. 180 s = 4.3 × 10⁻⁴), c, d NADPH sensor iNAP4 (p-values of panel d: 0 s vs. 60 s = 0.015, 0 s vs. 90 s = 0.001, 0 s vs. 120 s = 0.001, 0 s vs. 150 s = 0.001, and 0 s vs. 180 s = 0.006), e, f pH sensor cpYFP (p-values of panel f: 0 s vs. 30 s = 0.012, 0 s vs. 60 s = 0.036, 0 s vs. 90 s = 0.021, 0 s vs. 120 s = 0.015, 0 s vs. 150 s = 0.041, and 0 s vs. 180 s = 0.032) in plastid stroma of mesophyll cells (MCs), guard cells (GCs) and roots in response to white light illumination at 216 μmol m−2 s−1 (30-s intervals for 180 s) are presented. Asterisks indicate significant statistical differences (*P < 0.05) between the data points collected during illumination (30–180 s) and the data point collected before illumination (0 s), as determined by paired t-test, two-tailed (n = 5; mean ± SEM). The white and black bars at the top indicate the light and dark period, respectively. Scale bars, 10 µm. All iNAP results presented were normalized with stromal iNAPc. Ratio images are presented in pseudo-color, where red corresponds to high MgATP2– and NADPH levels and alkaline pH. Source data are provided as a source data file.

