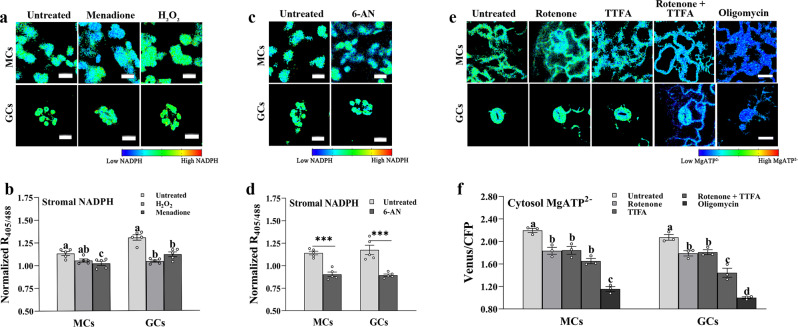
Fig. 3. Effects of various inhibitors on stromal NADPH and cytosolic ATP.
a, b Effect of H2O2 and menadione on guard cells (GCs) and mesophyll cells (MCs) expressing the NADPH sensor TKTP iNAP4 in the stroma (one-way ANOVA with Tukey’s HSD test at P < 0.05; n = 5; mean ± SEM; p-values of panel b (MCs): untreated vs. H2O2 = 0.055, and untreated vs. menadione = 0.008; p-values of panel b (GCs): untreated vs. H2O2 = 0.2 × 10⁻⁴, and untreated vs. menadione = 0.4 × 10⁻³). Different letters indicate significant statistical differences. Scale bars, 10 µm. c, d Effect of 5 mM 6-aminonicotinamide (6-AN) treatment on GCs and MCs expressing the NADPH sensor TKTP iNAP4 in the stroma. Cells were dark-adapted for 2 h prior to treatment with 6-AN (unpaired t-tests, two-tailed at ***P < 0.001; n = 5; mean ± SEM; p-value of panel d (MCs): untreated vs. 6-AN = 0.9 × 10⁻⁴; p-value of panel d (GCs): untreated vs. 6-AN = 0.001). Asterisks indicate statistically significant differences from untreated control. Scale bars, 10 µm. e, f Changes in cytosolic ATP levels upon treatment with 0.05 mM rotenone, 0.1 mM thenoyltrifluoroacetone (TTFA), 0.01 mM oligomycin or 0.05 mM rotenone with 0.1 mM TTFA in GCs and MCs (one-way ANOVA with Tukey’s HSD test at P < 0.05; n = 3; mean ± SEM, p-values of panel f (MCs): untreated vs. rotenone = 0.005, untreated vs. TTFA = 0.006, untreated vs. TTFA + rotenone = 0.2 × 10⁻³, and untreated vs. oligomycin = 5.7 × 10⁻⁷; p-values of panel f (GCs): untreated vs. rotenone = 0.019, untreated vs. TTFA = 0.03, untreated vs. TTFA + rotenone = 0.4 × 10⁻⁴, and untreated vs. oligomycin = 3.1 × 10⁻⁷). Different letters indicate significant statistical differences. Scale bars, 20 µm.Unless stated otherwise, all treated seedlings were incubated in the dark for 1 h before imaging. Ratios of the Venus/CFP and raw iNAP4 ratio before normalization are represented in pseudo-color images, where high ratios (red) correspond to high NADPH level and high MgATP2–. Source data are provided as a source data file.

