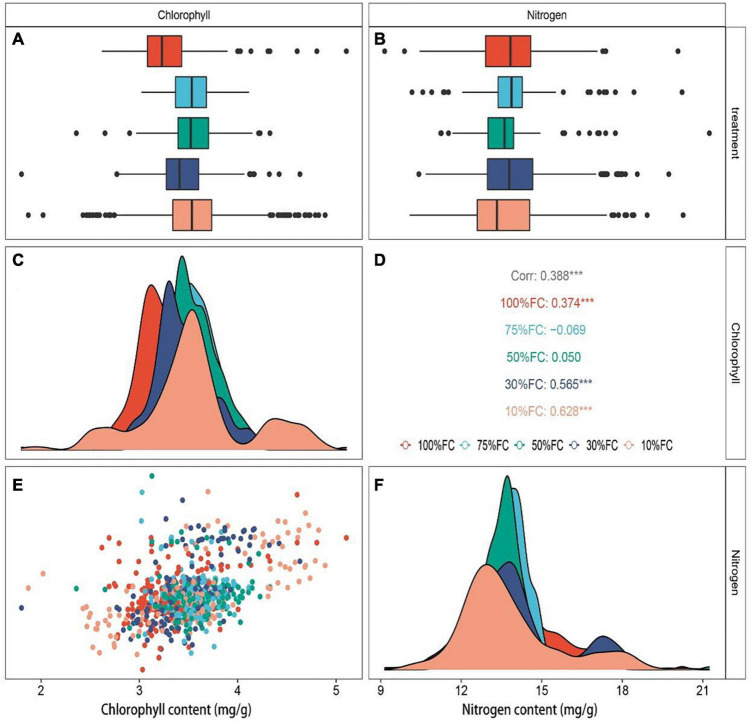
FIGURE 6.
Chlorophyll (A) and nitrogen (B) content under separate drought treatments. Correlation analysis of chlorophyll and nitrogen content of T. sinensis leaves under separate drought treatments (D). Chlorophyll (C) and nitrogen (F) content were normally distributed. Distribution map of chloroplast content of all samples (E). Statistical significance was determined by two-tailed t-test with equal variance comparing the unique drought treatments of chlorophyll and nitrogen content; ***p < 0.001. Different colors indicate separate treatments, and the corresponding colors are the same as the above figure.

