
Table 3.
The statistical and multivariate data analysis for identified metabolites before and after multiple sub-lethal exposures of A. baumannii to aPDT (increased levels of metabolites with p value < 0.05 are marked in red; decreased levels of metabolites with p value < 0.05 are marked in green; VIP values > 1.00 are marked in grey; metabolites with p value < 0.05 and VIP value > 1.00 are bolded).
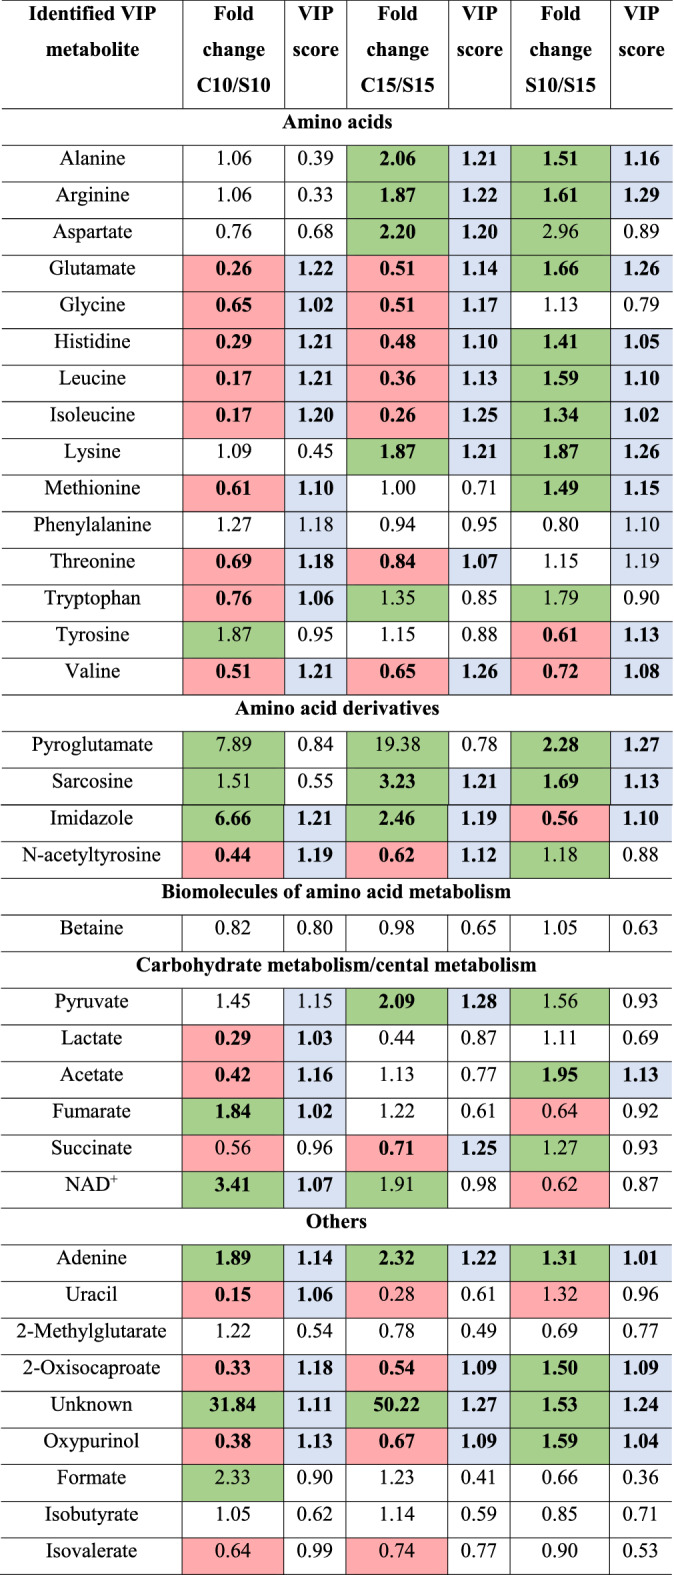
C10 or C15- cultures before phototherapies, after ten or fifteen inoculations (controls).
S10 or S15- cultures after ten or fifteen sub-lethal aPDTs.