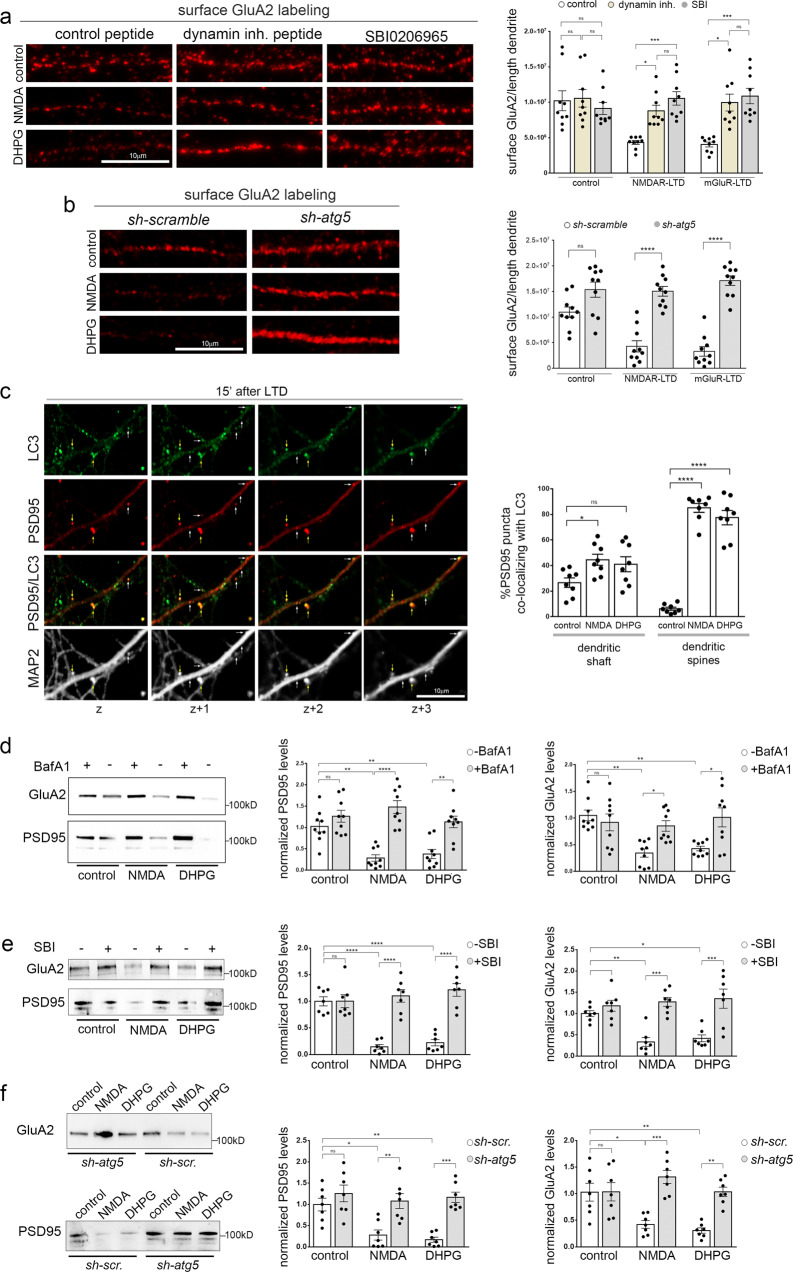
Fig. 4. Autophagy degrades key postsynaptic proteins during LTD.
a Confocal images of dendrites immunolabeled with an antibody against the extracellular region of GluA2 under control conditions or 15 min after LTD induction and in the absence or presence of Dynamin-1 inhibitory peptide (50 µM) or SBI-0206965 (500 nM), a selective inhibitor of the ULK1 kinase activity. Inhibitors were applied 25 min before, during and 15 min after the pulses. Scale bar: 10 µm. Graph showing the surface labeling of GluA2, normalized to dendritic length under the aforementioned conditions. Bars represent mean values ± SEM. N = 9 independent experiments. Statistical analysis was performed using one-way ANOVA (F (8, 72) = 7.411, P < 0.0001) (Tukey’s test Pcontrol-control/D > 0.99, Pcontrol-control/S = 0.9971, PNMDA-NMDA/D = 0.0451, PNMDA-NMDA/S = 0.0008, PDHPG-DHPG/D = 0.0017, PDHPG-DHPG/S = 0.0002). b Confocal images of dendrites of neurons expressing 4 scrambled sequences (sh-scramble), or 4 sh-RNAs against atg5 (sh-atg5), immunolabeled with an antibody against the extracellular region of GluA2 under control conditions or 15 min after LTD induction. Graph showing the surface labeling of GluA2, normalized to dendritic length under the aforementioned conditions. Bars represent mean values ± SEM. N = 10 independent experiments. Statistical analysis was performed using one-way ANOVA (F (5, 54) = 30.02, P < 0.0001) (Tukey’s test, Pcontrol/scr-control/atg5 = 0.0626, PNMDA/scr-NMDA/atg5 < 0.0001, PDHPG/scr-DHPG/atg5 < 0.0001, Pcontrol/atg5-NMDA/atg5 > 0.99, P control/atg5-DHPG/atg5 = 0.8602, Pcontrol/scr-NMDA/scr = 0.0008, Pcontrol/scr-DHPG/scr < 0.0001). c Representative images of consecutive confocal z-planes of cultured neurons immunostained with antibodies against PSD95, LC3, and MAP2 to label the dendrites, 15 min after cLTD. Note the colocalization of PSD95 and LC3 in dendritic spines (yellow arrows) and in the dendritic shaft (white arrows), in consecutive z-planes. Scale bar: 10 µm. Graph showing the percentage of PSD95 puncta co-localizing with LC3 in consecutive confocal z-planes in dendritic spines and shafts in control neurons or 15 min after chemically induced NMDAR- or mGluR-LTD. Bars represent mean values ± SEM. N = 8 independent experiments. Statistical analysis was performed by one-way ANOVA (F(5,42) = 48.43, P < 0.0001) (Tukey’s test for dendritic shaft, Pcontrol-NMDA = 0.0569, Pcontrol-DHPG = 0.1948, for dendritic spines, Pcontrol-NMDA < 0.0001, Pcontrol-DHPG < 0.0001). d Western blot analysis for GluA2 and PSD95 in lysates of cultured neurons in control conditions or 15 min after NMDAR- and mGluR-LTD and in the presence or absence of Bafilomycin A1 (50 µM) for 15 min before, during, and 15 min after the NMDA and DHPG pulses. e Western blot analysis for GluA2 and PSD95 in lysates of cultured neurons in control conditions or 15 min after NMDAR- and mGluR-LTD and in the presence or absence of SBI-0206965 (500 nM) for 30 min before, during, and 15 min after the NMDA and DHPG pulses. f Western blot analysis for GluA2 and PSD95 in lysates of cultured shscrambled or sh-atg5 expressing neurons in control conditions or 15 min after NMDAR- and mGluR-LTD. d–f Graphs showing the levels of PSD95 and GluA2 levels in the indicated conditions, normalized to total protein levels. Bars represent mean values ± SEM. Statistical analysis was performed by one-way ANOVA. d (N = 9 independent experiments) PSD95: F(5,48) = 15.08, P < 0.0001 (Tukey’s test Pcontrol-control/Baf = 0.7566, Pcontrol-NMDA = 0.0016, Pcontrol-DHPG = 0.0081, PNMDA-NMDA/Baf < 0.0001, PDHPG-DHPG/Baf = 0.0013. GluA2: F(5,48)=6.627, P < 0.0001 (Tukey’s test Pcontrol-control/Baf = 0.9692, Pcontrol-NMDA = 0.0014, Pcontrol-DHPG = 0.0067, PNMDA-NMDA/Baf = 0.0421, PDHPG-DHPG/Baf = 0.0127. e (N = 7 independent experiments) PSD95: F(5,36) = 23.80, P < 0.0001. (Tukey’s test Pcontrol-control/SBI > 0.99, PNMDA-NMDA/SBI < 0.0001, PDHPG-DHPG/SBI < 0.0001, Pcontrol-NMDA < 0.0001, Pcontrol-DHPG < 0.0001, Pcontrol/SBI-NMDA/SBI = 0.9764, Pcontrol/SBI-DHPG/SBI = 0.6286). Panel e, GluA2: F(5,36)=11.73, P < 0.0001. (Tukey’s test Pcontrol-control/SBI = 0.9179, PNMDA-NMDA/SBI = 0.0001, PDHPG-DHPG/SBI = 0.0002, Pcontrol-NMDA = 0.0099, Pcontrol-DHPG = 0.0323, Pcontrol/SBI-NMDA/SBI = 0.9959, Pcontrol/SBI-DHPG/SBI = 0.9407). f (N = 7 independent experiments) PSD95: F(5,36) = 10.93, P < 0.0001. (Tukey’s test Pcontrol/scr-control/atg5 = 0.7927, PNMDA/scr-NMDA/atg5 = 0.0045, PDHPG/scr-DHPG/atg5 = 0.0003, Pcontrol/scr-NMDA/scr = 0.0134, Pcontrol/scr-DHPG/scr = 0.0030, Pcontrol/atg5-NMDA/atg5 = 0.9488, Pcontrol/atg5-DHPG/atg5 = 0.9976). GluA2: F(5,36) = 10.79, P < 0.0001. (Tukey’s test Pcontrol/scr-control/atg5 > 0.99, PNMDA/scr-NMDA/atg5 = 0,0001, PDHPG/scr-DHPG/atg5 = 0.0019, Pcontrol/scr-NMDA/scr = 0.0134, Pcontrol/scr-DHPG/scr = 0.0021, Pcontrol/atg5-NMDA/atg5 = 0.5844, Pcontrol/atg5-DHPG/atg5 > 0.99).

