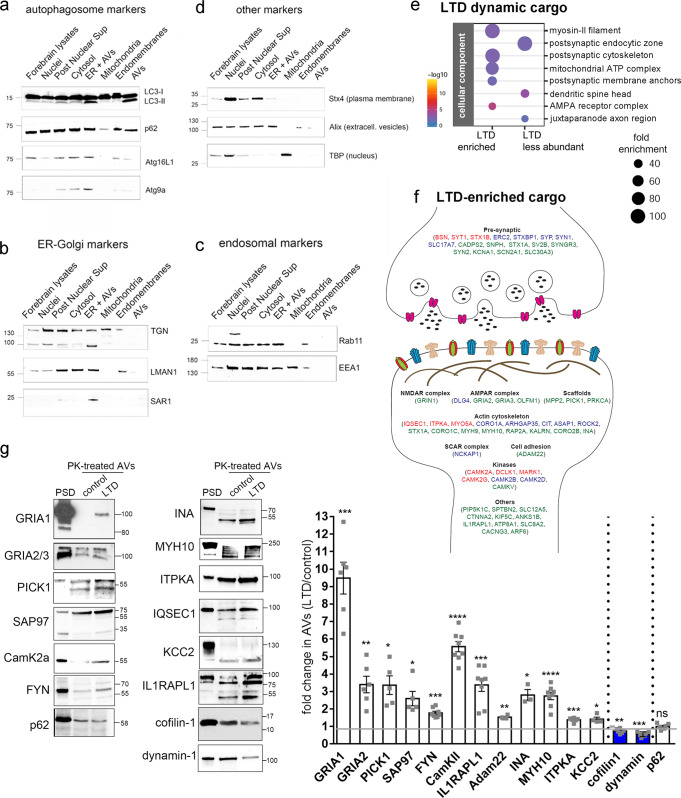
Fig. 5. Proteomic profiling of the autophagic cargo during NMDAR-LTD.
a–d Western blot analyses of different fractions along the autophagic vesicle purification procedure, using antibodies against a autophagosomal markers (LC3B, p62, Atg16L1, and Atg9A), b ER-Golgi markers (TGN, LMAN1, SAR1a), c endosomal markers (Rab11b, EEA1), and d markers of the plasma-membrane (Stx4), extracellular vesicles (Alix) and nuclear extracts (TBP). N = 3 independent experiments. e Graph showing the cell component analysis, as false discovery rate (FDR)-corrected p-values, of the dynamic cargo (total of 393 proteins) that is enriched (up) or less abundant (down) in AVs after LTD, compared to control. f Graphical representation of proteins enriched in AVs upon LTD, with relation to the synapse. g Western blot analysis of PK-treated control and LTD-AVs, validating the presence of the proteins identified by the proteomic analyses in the autophagic vesicles. Postsynaptic density (PSD) fraction was used as reference. Graph showing the fold change of the normalized levels of the proteins validated by western blot, as a ratio of LTD to control. Cargo proteins were normalized to the levels of p62, which remains unaffected at the early phase of LTD. N = 3 independent AV preparations. Bars represent mean values ± SEM. Statistical analysis was performed using paired, two-tailed Student’s t-test (GluA1,N = 6, P = 0.0002; GluA2, N = 6, P = 0.0039; Pick1, N = 5, P = 0.011; SAP97, N = 5, P = 0.0179; FYN, N = 8, P < 0.0001; CamKIIa, N = 8, P < 0.0001; IL1RAPL1, N = 8, P = 0.0004; Adam22, N = 4, P = 0.0018; INA, N = 3, P = 0.0287; MYH10, N = 8, P < 0.0001; ITPKA, N = 6, P = 0.0006; KCC2, N = 4, P = 0. 0352; cofilin-1, N = 6, P = 0.005; dynamin, N = 6, P = 0.0005; p62, N = 6, P = 0.9809). All indicated molecular weights in a–d and g are in kDaltons (kD).

