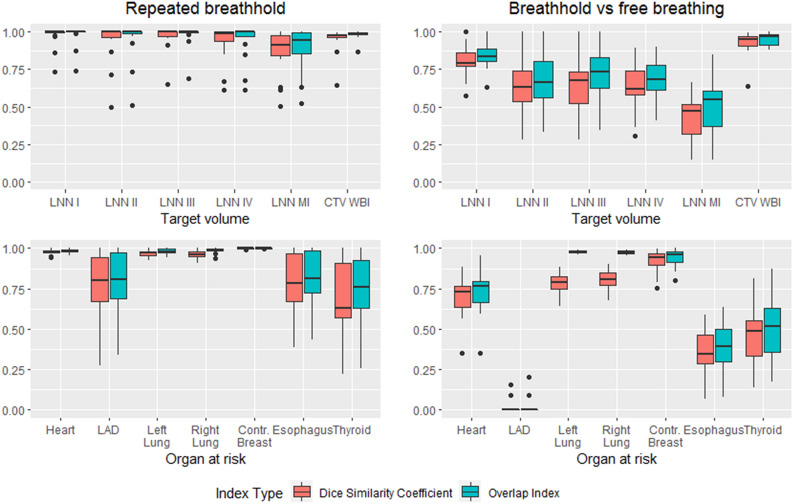
Figure 1.
Boxplot of the overlap measurements for targets and organs at risk for the repeated breathhold and failure to breathhold setting. The top row shows target volumes and the bottom row shows OARs, while the first column shows the situation for repeated breathhold and the second column shows the situation for failure to breathhold. Whiskers show 1.5 * interquartile range, outliers plotted as dots. Overlap index is consistently higher than Dice similarity coefficient for the same ROIs in the same breathing phase setting. Small volumes have poorer overlap measurements. This is especially visible in failure to breathhold setting.

