

Abstract
Worldwide there is great interest in producing low lactose milk and drinks, such as soy beverages, suitable for consumption by lactose-intolerant people. These products have different carbohydrate compositions, which affect quality indicators derived from Maillard reaction (furosine and 5-hydroxyl-methyl furfural, HMF). In this study, quality parameters have been determined in 11 commercial samples (8 lactose-hydrolyzed milks and 3 soy beverages). Presence of β-galactooligosaccharides in milks (22.2–458.1 mg/100 mL) correlating roughly with the remaining lactose content (1.9–357.7 mg/100 mL). Soy beverages contained α-galactosides in concentrations of 30–75 mg/100 mL. HMF and furosine were detected in all milk samples. In addition, powdered milks subjected to controlled storage (40 °C, aw 0.44) showed a furosine increase up to 88%. In conclusion, a great composition diversity was observed in the different products, probably favored by the lack of regulation and underline the importance of controlling processing and storage conditions to preserve product quality.
Keywords: Lactose hydrolyzed milk, Soy beverages, Furosine, HMF, β-Galactooligosaccharides, α-Galactosides
Introduction
Currently, due to the high prevalence of lactase deficiency (70% world population) (Ugidos-Rodriguez et al. 2018) many products are marketed nowadays as alternative to dairy products for lactose-intolerant individuals. Two important types of these products are lactose hydrolyzed (LH) milks (Forero et al. 2014) and soy beverages (Amigo-Benavent et al. 2007). These products can represent an important source of nutrients for people with lactose intolerance and the latter also for people with allergy to bovine milk and a good alternative for vegetarians (Forero et al. 2014). Data are available on the characterization and quality evaluation of these milks and commercial beverages from countries with temperate climate (Adhikari et al. 2010; Montilla et al. 2015; Rada-Mendoza et al. 2005; Ruíz-Matute et al. 2012; Messia et al. 2007). However, this type of data does not exist for these products marketed in countries with a warm climate, such as Colombia, which may need to subject the drinks to more severe thermal treatments for its adequate preservation (Forero et al. 2014). Furthermore, it should be noted that the frequency of lactose intolerance varies widely depending on population subgroups considered, being for Northern-Central Europe only 5%, for African-Americans of 60–70% and Asians (SE) 90% (Ugidos-Rodriguez et al. 2018).
Two important types of quality markers for LH-UHT and powdered milks and soy beverage can be considered, the presence of prebiotic oligosaccharides and compounds from Maillard reaction (MR). During manufacture of LH milks, galactooligosaccharides (GOS), recognized prebiotics, are formed via enzymatic transgalactosylation of lactose catalyzed by β-galactosidases (Gibson et al. 2017; Mahoney 1998). It has been shown that the amount of these important compounds depends of lactose hydrolysis control (Ruiz-Matute et al. 2012). Several studies have shown that GOS may not only exert a bifidogenic effect but also improve the absorption of calcium, the symptomatology of constipation and reinforce the immune response, between other beneficial effects (Gibson et al. 2017). In the case of soy beverages the α-galactosides, mainly raffinose and stachyose are the compounds with potential prebiotic activity (Corzo-Martínez et al. 2016).
On the other hand, the main result during lactose hydrolysis is the release of large amounts of monosaccharides, glucose and galactose, which are more prone than lactose to participate in the MR that takes place during milk heating process and storage (Tossavainen and Kallioinen 2008). The progress of this reaction may be lower in soy beverages due to the lower amount of monosaccharides (Amigo-Benavent et al. 2007; Brereton and Green 2012). The different intensity of the processes used can lead to a wide variability in the concentration of quality markers such as hydroxymethylfurfural (HMF) and furosine (generated from the acid hydrolysis of the Amadori compound lactulosyl-lysine, the first stable compound of the MR) found in different commercial samples of LH-UHT milks (Messia et al. 2007) and soy beverages (Amigo-Benavent et al. 2007). The extent of heat damage can be assessed by analyzing these markers (Rada-Mendoza et al. 2005).
The objective of this work is to investigate the quality of lactose hydrolyzed milks and soy beverages marketed in Colombia, as an example of warm climate country. The study of these indicators processing aims to provide consumers with lactose intolerance high quality products worldwide. To this end, we have studied in commercial samples the carbohydrate composition and the extent of non-enzymatic browning, using furosine and HMF determinations.
Material and methods
Standards and samples
Lactose, d-galactose, d-glucose, fructose, β-1,6-galactobiose, raffinose and phenyl-β-glucoside were purchased from Sigma (St. Louis, MO, USA). Allolactose, 6′-galactosyl-lactose and 4′-galactosyl-lactose were standards previously synthesized in the CIAL laboratory (Martinez-Villaluenga et al. 2008).
Eight commercial samples were obtained from local supermarkets in Colombia (Code C-). For comparative purposes two Spanish commercial samples and one lactose-hydrolyzed (LH) milk powder, kindly provided by a Spanish dairy company (CAPSA, Asturias, Spain), were analyzed (Code S-). Eight samples were LH milks (6 UHT milk and 2 powdered milk), and 3 samples were soy beverages (Table 1).
Table 1.
Values of pH, aw, dry matter (DM) (%), protein (%), total low molecular weight carbohydrates (% DM) in LH-UHT and powdered milks and soy beverages
| Sample | Code | pH | aw | DM (%) | Protein (%) | Protein in DM (%) | Total low molecular weight carbohydrates (% DM) |
|---|---|---|---|---|---|---|---|
| LH-UHT milks | C-UHT-1 | 6.7 | 10.1 | 3.2 | 31.7 | 32.9 | |
| C-UHT-2 | 6.6 | 10.0 | 3.1 | 31.0 | 49.9 | ||
| C-UHT-3 | 6.6 | 9.4 | 3.3 | 35.1 | 55.6 | ||
| C-UHT-4 | 6.6 | 9.3 | 3.0 | 32.3 | 48.0 | ||
| C-UHT-5 | 6.7 | 8.8 | 2.9 | 33.0 | 53.4 | ||
| S-UHT | 7.0 | 9.9 | 3.7 | 37.4 | 52.4 | ||
| LH Powdered milks | C-Powder | 6.7 | 0.26 | 95.9 | 19.4 | 20.2 | 34.8 |
| S-Powder | 6.5 | 0.27 | 90.5 | 32.8 | 36.2 | 53.4 | |
| Soy beverages | C-Soy-1 | 7.2 | 10.3 | 2.5 | 24.3 | 25.4 | |
| C-Soy-2 | 6.7 | 11.2 | 3.1 | 27.7 | 44.8 | ||
| S-Soy | 7.2 | 6.0 | 2.0 | 33.3 | 28.8 |
Data are mean values (± standard deviation)
The two LH powdered milks were stored at 0.44 aw and 40 °C for 21 days; samples were taken after 3, 6, 10, 13 and 21 days of storage.
All commercial samples, in duplicate, were stored at refrigeration temperature and analyzed before the best-before date. All analyses were performed in duplicate.
Analytical determinations
The pH of the samples was measured at 20 °C in a MP225 pH-meter with a glass electrode (Mettler Toledo GmbH, Schwerzenbach, Suiza). Powdered milk samples were reconstituted in MilliQ water at 10% w/v, for pH and other determinations. The dry matter (DM) was determined in an oven at 102 °C for 48 h. The protein content was analyzed by the Kjeldahl method (AOAC 1990). The aw in the powdered milks was determined at 25 °C in a Novasina aw Sprint TH-500 (Pfäffikon, Switzerland).
RP-HPLC–UV analysis of furosine
To determine the furosine content, 1 mL of liquid milk or 120 mg of solid sample was hydrolyzed with 3 mL of 10.6 N HCl or 8 N HCl, respectively, at 110 °C for 23 h. After, the hydrolyzed samples were analyzed by ion-pair RP-HPLC–UV (Rada-Mendoza et al. 2005), using a C8 Alltech furosine-dedicated column (250 × 4.6 mm, 5 µm; Alltech, Laarne, Belgium) with a linear, binary gradient (A, 4 mL/L acetic acid; B, 3 g/L KCl in A; 100% A from 0 to 12 min, 50% A from 20 to 22.5 min, and 100% A from 24.5 to 30 min) and detection at 280 nm wavelength. Data were expressed as milligrams of furosine per 100 g of protein.
GC analysis of carbohydrates
Carbohydrate analysis was conducted by GC-FID following the Corzo-Martínez et al. (2016) method. Trimethyl silylated oximes (TMSO) of the low molecular weight carbohydrates were formed following the Brobst and Lott (1966) method and analyzed using a HP-5MS capillary column (5% phenyl methylsilicone, 25 m × 0.32 mm × 0.25 µm thickness, J&W Scientific, Folson, California, USA). Injector and detector temperatures were 280 and 315 ºC, respectively; oven temperature program was increased from 180 to 315 ºC at 3 ºC/min and kept 30 min. Phenyl-β-glucoside (Sigma Chemical Co., St. Louis, MO) was used as an internal standard. Data were the mean values of duplicates expressed as mg/100 mL, considering powdered milk reconstituted at 10% w/v.
HPLC–UV analysis of 5-hydroxyl-methyl furfural
The HMF content was determined by HPLC–UV following the method of Morales and Jiménez-Pérez (1999). A C18 5 ACE column (ACE, UK) (250 mm × 4.6 mm, 5 µm) maintained at 25 °C and a linear gradient with methanol and water was used. Quantitation was carried out by the external standard method using a commercial standard of HMF (Sigma, St. Louis, MO, USA). Data were the mean values of duplicates expressed as µg/L, considering powdered milk reconstituted at 10% w/v.
A statistical analysis of all data was carried out using the statistical software SPSS 9.0.1. for Windows (1999).
Results and discussion
Characterization of commercial samples
Table 1 shows the codes and the values of pH, DM, aw, total protein and total carbohydrates of the commercial samples studied. Lactose-hydrolyzed milks showed pH values in the 6.5–7.0 range. Similar values of pH have been previously reported by other authors in bovine milks and special milks (Rada-Mendoza et al. 2005) and LH dairy preparations for the elderly (Montilla et al. 2015). Soy beverages showed pH values in the range 6.7–7.2, slightly higher than in milks and similar to values reported by Amigo-Benavent et al. (2007).
The LH powdered milk from Colombia (C-Powder) had higher value of DM, (95.9%) as compared to the Spanish one (S-Powder) (90.5%). In general, these values were as expected for this type of product (Torres et al. 2017). In the case of the C-Powder sample, the found value was right in the limit recommended by Colombian Decree 6.16 (Ministry of Social Protection 2006). This limit is necessary to guarantee the stability of powdered milk in countries with warm and humid climate. The LH-UHT milks presented values of solid DM between 8.8 and 10.1%, three of them (C-UHT-3, C-UHT-4 and C-UHT-5) having values lower than 9.7%, in conflict with the limit established by the Ministry of Social Protection (2006) for UHT milks. Similar values of DM have been previously reported by Forero et al. (2014) for LH-UHT milks. Soy beverages presented values in the range 6–11.2%, the value of Spanish sample (S-Soy) being extremely low, probably ascribed to an excess of dilution.
In powdered milk samples, the aw values were lower than 0.30, similarly to those obtained by Torres et al. (2017). These values might maintain the microbiological stability since most bacteria cannot grow at an aw below 0.9; powdered products usually have aw values lower than 0.6. Regarding non-enzymatic browning, limited reaction advance could be expected since maximum browning is produced in dehydrated foods at 0.65–0.75 aw (Pereyra-Gonzales et al. 2010).
In general, the protein content of liquid milk samples was within the range 3.7–2.9%, in line with data reported in the literature (Montilla et al. 2015; Rada-Mendoza et al. 2005). However, the C-Powder sample had a value of 20.2%, in contradiction to Colombian Decree 6.16 (Ministry of Social Protection 2006) which establishes 30% as the minimum protein content allowed for these milks. The soy beverages, except the C-Soy-2 sample (3.1%), presented low levels of proteins (2.0 and 2.5%), lower than those reported by Amigo-Benavent et al. (2007) (2.6–3.9%) for samples marketed in the EU.
Evaluation of carbohydrate composition
Qualitatively, in LH milk samples, monosaccharides (galactose, glucose and fructose), disaccharides (lactose, allolactose and 6-galactobiose) and trisaccharide (6′-galactosyl-lactose), were identified by comparison of their retention times and mass spectra with those from commercial and lab standards (Martínez-Villaluenga et al. 2008). In the case of the C-Powder sample, other sugars such as maltose, maltotriose and maltotetraose were detected, possibly due to the addition of maltodextrin.
In general, the content of carbohydrates with respect to DM (Table 1) was of around 50% (49.9–55.6%) except in C-UHT-1 and C-Powder samples with 32.9 and 34.8%, respectively. Considering the composition of the powdered milk, it is possible that this sample contains maltodextrins, according to its higher glucose content and the presence of maltose, maltotriose, and maltotetraose (Table 2). Other maltodextrins with higher degrees of polymerization (DP ≥ 5) could be also present, although the used chromatographic method did not allow their determination (Corzo-Martínez et al. 2016), giving rise to an underestimation of the total carbohydrate content. It has been shown that incorporation of maltodextrin improve the stability of powders (Masum et al. 2020).
Table 2.
Content of monosaccharides (galactose, Ga; glucose, Glu; fructose, Fru); disaccharides, (lactose, La; other disaccharides, Ot Dis; allolactose, Allo, 6′-galactobiose, 6-Gal); trisaccharides (6′galalctosyl-lactose, 6′Gal-La) and Total GOS (mg/100 mL) found in commercial LH-UHT and dried powder special milks
| Sample | Ga | Glu | Fru | La | Ot Dis | Allo (mg/100 mL) | 6-Gal | 6′-Gal La | Maltotriose | Maltotetraose | Total GOS |
|---|---|---|---|---|---|---|---|---|---|---|---|
| C-UHT-1 | 1517a | 1741a | 22.9c | 3.6b | 14.7a | 9.8a | 8.2 | 2.2 | N.D | N.D | 34.9b |
| (439) | (332) | (5.8) | (0.7) | (3.5) | (2.9) | (2.6) | (0.7) | (5.3) | |||
| C-UHT-2 | 2453b | 2478b | 27.1c | 3.7b | 10.8a | 9.2a | 7.5 | 2.0 | N.D | N.D | 29.5b |
| (439) | (332) | (5.8) | (0.7) | (3.5) | (2.9) | (2.6) | (0.7) | (5.3) | |||
| C-UHT-3 | 2123b | 2291b | 19.8b | 357.7f | 60.5b | 183.7e | 84.9 | 23.5 | 72.3 | 9.6 | 434.5f |
| (103) | (130) | (3.0) | (30.3) | (6.5) | (18.4) | (9.7) | (3.4) | (31.6) | (1.5) | (68.7) | |
| C-UHT-4 | 2112b | 2302b | 21.8b | 1.9a | 11.4a | 10.8a | N.D | N.D | N.D | N.D | 22.2a |
| (159) | (47) | (0.0) | (0.1) | (0.9) | (1.7) | ||||||
| C-UHT-5 | 1771a | 2230b | 41.9d | 194.2e | 84.9c | 165.8e | 106.0 | 28.9 | 61.5 | 11.0 | 458.1f |
| (154) | (146) | (4.4) | (14.6) | (5.6) | (14.5) | (7.5) | (1.5) | (3.0) | (1.3) | (62.4) | |
| S-UHT | 2446 b | 2636c | 28.8c | 3.1b | 27.3a | 14.4b | 13.8 | 15.7 | N.D | N.D | 71.2c |
| (41) | (17) | (0.8) | (0.7) | (17.4) | (0.1) | (0.0) | (2.9) | (1.0) | |||
| C-Powder* | 1101a | 1579a | 15.1a | 109.8d | 119.5*d | 133.3d | 79.7 | 21.8 | 136.5 | 43.2 | 354.3e |
| (93) | (98) | (0,4) | (8.5) | (12.1) | (12.5) | (7.8) | (2.4) | (17.4) | (5.8) | (51.8) | |
| S-Powder* | 2257b | 2472b | 17.6b | 7.9c | 25.8a | 21.4c | 16.9 | 10.9 | 75.1d | ||
| (127) | (62) | (1.6) | (0.2) | (1.4) | (0.4) | (0.5) | (0.3) | (5.3) |
Data are mean values (± Standard deviation). Means followed by different letters in each column were significantly different (LSD, Tukey and Bonferroni: P < 0.05). Compounds with data indicated as ND (not detected) were not included in the statistical analysis
*Reconstituted at 10% w/v
In LH milks (C-UHT-1, C-UHT-2, C-UHT-4, S-UHT and S-Powder, Table 2), lactose content varied from 1.9 to 7.9 mg/100 mL. These values are close to those previously reported by Ruiz-Matute et al. (2012), and could be considered lactose-free milks in some EU Member States (lactose content < 10 mg/100 mL) (EFSA Panel on Dietetic Products 2010). Other samples (C-UHT-3, C-UHT-5 and C-Powder), showed a higher lactose content, between 357.7 and 109.8 mg/100 mL and could be considered low-lactose milks (lactose content < 1000 mg/100 mL) (EFSA Panel on Dietetic Products 2010). Rada-Mendoza et al. (2005) reported higher lactose content (≥ 594 mg/100 mL). However, it should be considered that such products have undergone and evolution in last decades, with products labeled "lactose free" being more frequent than those labeled as "lactose-reduced", although in many countries there is no definition for these terms.
The main sugars present in LH milks were glucose and galactose, and their levels varied between 1579 and 2636 mg/100 mL (glucose), and 1101 and 2453 mg/100 mL (galactose). The lower amount of galactose as compared to glucose could be due to the transgalactosylation reaction of lactose. According to the amount of these monosaccharides, two samples (C-UHT-1 and C-Powder) presented lower values than expected. Fructose and tagatose (quantified together) were also found and ranged from 15.1 to 41.9 mg/100 mL. All data of monosaccharides followed the same trend that those of Ruiz-Matute et al. (2012) for LH milks marketed in the EU.
Regardless if UHT-treatment was carried out before or after the enzymatic hydrolysis, the presence of tagatose could indicate that lactose has been hydrolyzed before UHT treatment since galactose is only present in very small quantities in milk and tagatose has not been detected in UHT milk (Rada-Mendoza et al. 2005).
Total GOS content varied among samples in a range of 22.2–458.1 mg/100 mL, increasing with the remaining lactose content. Thus, samples C-UHT-3, C-UHT-5 and C-Powder showed the highest levels of GOS (458.1–354.3 mg/100 mL) and lactose (> 100 mg/100 mL), whereas sample C-UHT-4 presented the lowest levels of both (GOS 22.2 mg/100 mL and lactose 1.9 mg/100 mL). According to Ruiz-Matute et al. (2012) the maximum formation of GOS during controlled lactose hydrolysis of milks is about 1000 mg/100 mL, when 75–90% of lactose was hydrolyzed, and, then, they gradually decreases below 500 mg/100 mL when over 99% of the lactose is hydrolyzed. Mahoney (1998) reported that samples with contents of around 780 mg/100 mL of GOS, were suitable to exert a beneficial effect on consumer health as prebiotics; however, in the samples here analyzed the GOS content was lower. In all samples the most abundant GOS were the disaccharides allolactose (183.7–9.2 mg/100 mL) and 6′-galactobiose (106.0–7.5 mg/100 mL), whereas the only trisaccharide identified was 6′-galactosyl-lactose, present in C-UHT-3, C-UHT-5 and C-Powder, with the highest levels of GOS. These compounds were also detected in others LH milk and dairy products (Montilla et al. 2015; Ruiz-Matute et al. 2012). They are the most relevant di- and trisaccharides formed with β-galactosidase of Kluyveromyces lactis (Martínez-Villaluenga et al. 2008), highlighting that this enzyme is the most important to obtain lactose-free products because its high hydrolytic activity, even higher than that present in other important β-galactosidases such as from Aspergillus oryzae and Bacillus circulans (Fischer and Kleinschmidt 2018).
Table 3 shows the carbohydrate composition of commercial soy beverages. Due to the absence of lactose, these products can be consumed as milk substitutes for people with severe lactose intolerance. However, despite their significant expansion in the market, there is a lack of regulation regarding quality. As shown, the content of quantified carbohydrates in 2 of the 3 samples was much lower than that of milk (< 30% with respect to DM). Moreover, the main sugar is sucrose (1503–4565 mg/100 mL soy beverages) corresponding to 97% of total carbohydrates, which may be due to the addition of this sugar. This point should be considered in relation to the latest WHO recommendation regarding sugar consumption (WHO 2015), which should be to less than 10% of total energy intake, and ideally, it should be reduced to less than 5% per day. However, the average consumption of free sugar in many countries exceeds these levels, especially in children (WHO 2015).
Table 3.
Content of pinitol (Pin), other monosaccharides (Mon), galactose (Ga), glucose (Glu), fructose (Fru), myo-inositol (Myo), others disaccharides (Dis), sucrose (Sc), raffinose (Raf), others tetrasaccharides (Tetras), stachyose (Sta) and total carbohydrates (Total CH) (mg/100 mL) found in soy drinks commercial milks. Data are mean values (± standard deviation)
| Sample | Concentration | Pin | Mon | Ga | Glu | Fru | Myo | Dis | Sc | Raf | Tetras | Sta | Total CH |
|---|---|---|---|---|---|---|---|---|---|---|---|---|---|
| C-Soy-1 | (mg/100 mL) | 7.7a | N.D | 8.5a | 2.2a | 1.5 | N.D | 27.8b | 2543b | 29.8a | N.D | N.D | 2621b |
| (4.8) | (2.3) | (0.7) | (0.4) | (8.1) | (732) | (13.1) | |||||||
| (% w/w DM) | 0.1 | 0.1 | 0.0 | 0.0 | 0.3 | 24.7 | 0.3 | 25.4 | |||||
| C-Soy-2 | (mg/100 mL) | 39.2b | 27.8 | 27.8b | 4.2b | 8.8 | 4.9 | 33.8c | 4565c | 74.9b | 32.2 | 199.1 | 5018c |
| (9.5) | (0.7) | (3.2) | (0.3) | (0.6) | (0.0) | (1.0) | (154) | (6.7) | (5.2) | (14.2) | |||
| (% w/w DM) | 0.4 | 0.3 | 0.2 | 0.0 | 0.1 | 0.0 | 0.3 | 40.8 | 0.7 | 0.3 | 1.8 | 44.8 | |
| S-Soy | (mg/100 mL) | 48.1b | 31.5 | 12.1a | 2.6a | N.D | 2.9 | 17.4a | 1503a | 67.1b | N.D | 40.4 | 1725a |
| (4.0) | (0.1) | (2.6) | (0.7) | (0.1) | (0.4) | (23.9) | (5.6) | (4.0) | |||||
| (% w/w DM) | 0.8 | 0.5 | 0.2 | 0.0 | 0.0 | 0.0 | 0.3 | 25.1 | 1.1 | 0.7 | 28.8 |
Means followed by different letters in each column were significantly different (LSD, Tukey and Bonferroni: P < 0.05)
Regarding other low molecular weight carbohydrates presents in these samples, the main monosaccharides found were pinitol (3-O-methyl-D-chiro-inositol) (7.7–48.1 mg/100 mL soy beverage), the major cyclitol present in developing soybean seed tissues (Kuo et al. 1997) and galactose (8.5–27.8 mg/100 mL soy beverage). Fructose, glucose and myo-inositol were also present. After sucrose, α-galactosides were the most abundant, although their amounts varied within a wide range in the three samples analyzed (30–274 mg/100 mL soy beverage, 0.3–2.4% DM). Taking into account these results, these products should not be considered soymilk made from whole dried soy beans which are soaked in water, ground, filtered and heated, containing higher amount of α-galactosides with respect to total sugars. Brereton and Green (2012) analyzed a soy permeate and found 1.4 mg/g of raffinose. Corzo-Martínez et al. (2016) characterized industrial soy permeate with a content of 5.6% of raffinose and 21.3% of stachyose with respect to DM. Thus, these products should be considered soy drinks or soy beverages, a stabilized emulsion of oil, soy protein, and sucrose. With the exception of Japan, there is no widely accepted official ‘‘Standard of Identity’’ for soy beverages (Brereton and Green 2012).
Evaluation of Maillard reaction
Table 4 shows that the levels of furosine found in LH-UHT milks samples were 97–490 mg/100 g protein. These values were similar to those reported for lactose-reduced by Rada-Mendoza et al. (2005) (376–432 mg/100 g protein); Messia et al. (2007) (162–1071 mg/100 g protein), and Ruiz-Matute et al. (2012) (244–411 mg/100 g protein) for LH commercial milks, and Montilla et al. (2015) (236–820 mg/100 g protein) for special dairy preparations designed for elderly people with hydrolyzed lactose. They were considerably higher than those reported for UHT milks (Messia et al. 2007; Van Renterghem and De Block 1996) (35–271 mg/100 g protein). In general, the high furosine contents in LH dairy products indicated that the UHT treatment was applied after lactose hydrolysis, since LH milk, with high content of reducing monosaccharides, can be more susceptible to the MR than non-hydrolyzed milk (Montilla et al. 2015).
Table 4.
Values of Furosine (mg/100 g protein) and HMF (µg/L) in commercial samples. Data are mean values (± standard deviation)
| Sample | Furosine (mg/100 g protein) | HMF (µg/L) |
|---|---|---|
| C-UHT-1 | 198.8 (12.4)b | 66 (2)b |
| C-UHT-2 | 195.7 (6.7)b | 118 (11)f |
| C-UHT-3 | 100.0 (5.6)a | 54 (1)a |
| C-UHT-4 | 228.4 (2.9)c | 92 (1)d |
| C-UHT-5 | 490.0 (49.3)d | 69 (0)c |
| S-UHT | 96.5 (1.9)a | N.D |
| C-Powder | 933.4 (84.9)e | 357* (3)g |
| S-Powder | 1729.6 (87.3)f | 102* (2)e |
| C-Soy-1 | 25.1 (1.4)c | 205 (1) |
| C-Soy-2 | 16.0 (0.0)b | N.D |
| S-Soy | 12.7 (0.2)a | N.D |
Means followed by different letters in each column were significantly different (LSD, Tukey and Bonferroni: P < 0.05)
*Reconstituted at 10% w/v
The concentrations of furosine were very elevated in powdered milks (933 and 1730 mg/100 g of protein), higher than those obtained in the rest of the commercial samples analyzed as compared to those found by other authors for powdered milk. The different contents in the two samples could be due to the lower amount of reducing sugars and protein in the Colombian (C-Powder) versus the Spanish (C-Powder) sample. In addition, C-Powder contained maltodextrin and, in infant formula, it was observed a decrease in the reducing power of the sugar when maltodextrins are added to replace lactose, these formula having lower furosine levels than 100% lactose formulas (Birlouez-Aragon et al. 2010). Van Renterghem and De Block (1996) reported values between 170 and 300 mg/100 g of protein, while Baptista and Carvalho (2004) found a value of 52 mg/100 g of protein for fresh commercial powdered milk. The presence of high amount of furosine may be due to the progress of MR during the obtainment of powdered milk. Naranjo et al. (2013) observed that the kinetic constants calculated for lactose hydrolyzed milk powder were 10 to 20-fold higher than those reported for skimmed milk powder at the same aw and temperature conditions. It must be taken into account that this excessive formation of furosine gives rise to a loss of available lysine and changes in the organoleptic characteristics, as also reported by Rada-Mendoza et al. (2005).
An important consideration to avoid the excessive evolution of the MR could be the control of lactose hydrolysis, favoring the higher concentration of GOS. The progress of MR has been shown to be less intense in GOS-enriched milks (Zhang et al. 2020). In this way, products with improved functionality, with a high content of prebiotic carbohydrates, low levels of lactose and less losses of lysine would be obtained using the appropriate reactions conditions, including the selected enzyme, different from those used at present by industry.
The furosine content of soy beverages (12.7–25.1 mg/100 g protein) was found to be very low when compared to LH milks, according to their low content of reducing sugars. However, these values (6.3–2.5 mg/L) were lower than others found for liquid soy beverages (25–96 mg/L) (Arques et al. 2016). Amigo-Benavent et al. (2007) analyzed 13 soymilks and soy beverages and only found furosine in three samples with a content of 25.6–69.1 mg/100 g of protein.
As known, furosine is an indicator of the first steps of MR and HMF of the intermediate MR steps, although it can also be formed by hexoses dehydration. This thermal marker was not detected in soy beverages (C-Soy-2 and S-Soy) and in Spanish LH sample (S-UHT), all of them with low values of furosine. For the other LH-UHT milks the range of HMF concentration was 54 –118 µg/L, for LH powdered milks 102–357 µg/L, and 205 µg/L in C-Soy-1. The highest HMF content was found in the C-Powder sample, although it showed a low furosine value. This could be ascribed to the fact that HMF can be formed, as above indicated, by dehydration of hexoses such as glucose and fructose, and from the breakdown of sucrose (Ameur et al. 2007). These authors observed that HMF started to accumulate at aw lower than 0.5. Therefore, HMF can be formed during milk drying processes, and the low final moisture of C-Powder (4.1%) than S-Powder (9.5%) can explain the low HMF content of latter sample. Morales and Jiménez-Pérez (1999) determined free HMF for UHT and sterilized milk samples found contents in the range of 37–76 and 169–315 µg/L for both types of milks, respectively. For LH milk, only HMF data are reported by Urgu et al. (2017) for UHT milks in a range between 272 and 1607 µg/L, while for LH milks it was between 3449 and 4506 µg/L. However, the data of the latter study were reported very high. Aktag et al. (2019) found HMF concentrations between 0.1 at 0.4 mg/L in protein fortified LH milks. Finally, the high sucrose content of C-Soy-1, can explain also its high HMF content. Arques et al. (2016) analyzed six samples of soy beverages and found HMF only in two samples and at low concentrations (11–24 µg/L).
Assessment of lactose hydrolyzed powdered milk storage
Given the few existing reports about the effect of lactose hydrolysis on the properties of powdered milk during production and storage, a study was conducted on the evolution of furosine and HMF in these products. Two sets of samples (C-Powder and S-Powder) were subjected to storage assays (40 °C, aw 0.44 for 21 days).
In both samples, a significant increase in the level of furosine was detected after storage (1753 and 2090 mg/100 g of protein for C-Powder and S-Powder, respectively) (Fig. 1a). The maximum furosine increase in the C-Powder sample was of 88% after 21 days and for S-Powder was 25% at 10 days and after it decreased slightly. This general increase could be due to the elevated concentration of monosaccharides after the hydrolysis of lactose (Table 2), which can react with the ε-amino group of lysine giving rise to the corresponding Amadori compound. The Amadori content could decrease with the time, because MR can progress to more advanced stages and the rate of formation of the Amadori compounds could be inferior to their decomposition (Guerra-Hernandez et al. 2002).
Fig. 1.
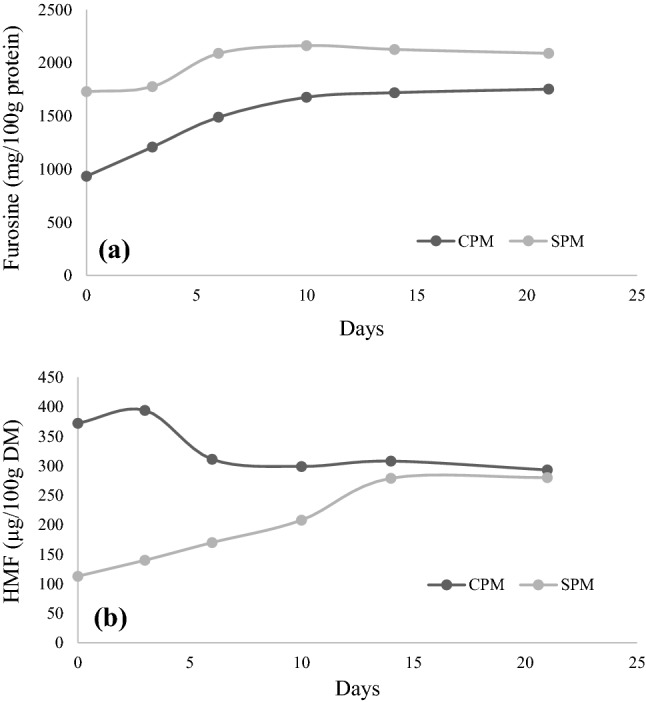
Evolution of furosine and HMF during storage of powder milks (C-Powder (CPM), S-Powder (SPM)) for 21 days at 40 °C and aw 0.44
In contrast, the evolution of HMF during storage in the two samples was different (Fig. 1b); while in S-Powder it increased continuously up to 280 µg/100 g DM (248%, in relation to the initial value), for C-Powder the content of HMF decreased up to 293 µg/100 g DM (79% in relation to the initial value). These dissimilarities could be attributable to the different advance of the reaction, higher in the C-Powder sample. Li et al. (2019) observed in commercial powdered milk storage at room temperature that the HMF values of most of the samples increased at the beginning of storage and then decreased.
Conclusion
According to the results obtained, the lack of regulations for the products here studied favors the industry not supplying high-quality drinks to lactose-intolerant consumers. Some products have excessively low DM and protein values. In the case of the two powdered milks analyzed, the great disparity could be justified by the addition of maltodextrin to the Colombian sample, to favor the drying process achieving a powder with low humidity and, therefore, more stable during storage. This diversity of products is especially relevant in soy beverages, where the Spanish sample has an extremely low DM, but in Colombian products, the highest DM is achieved with the addition of sucrose, an inappropriate measure according to WHO recommendations.
In addition, lactose hydrolyzed milks are more sensitive to the MR and, in general, the samples from Colombia seem to have been subjected to more intense thermal or drying treatments, in order to guarantee their stability during the product shelf-life. This is not surprising since it is a country with a warm climate and, in this study, it has also been seen how storage under inappropriate conditions causes the MR advance.
In general, the results obtained in this paper highlight the need to oversee all processing conditions during lactose hydrolysis, thermal treatment, and storage to increase the level of prebiotic carbohydrates with low levels of lactose and minimize the loss of lysine. Particularly, in the case of warm environments, lactose hydrolysis prior to controlled heating could avoid the inconvenience of the addition of lactase in aseptic conditions after heating. Also, the galactooligosaccharides content could be maintained due to the inactivation of enzyme and this would favor the control of Maillard reaction. These data are very important in countries such as Colombia with a high prevalence of lactose intolerance and consumption of hydrolyzed lactose milks given that, unlike other countries, there is little data available on the characterization and quality assessment of such milks and drinks.
Acknowledgements
The authors would like to thank Universidad del Cauca in Colombia and CIAL (CSIC-UAM) in Spain. This study was funded by the Vice-Chancellor’s Office of Research. Spain Projects (MINECO) AGL2014-53445-R; AGL2017-84614-C2-1-R; EMHE-CSIC 2017 MHE-200047 from CSIC.
Abbreviations
- C-Powder
Powdered milk from Colombia
- DM
Dry matter
- GOS
Galactooligosaccharides
- HMF
5-Hydroxyl-methyl furfural
- LH
Lactose hydrolyzed
- MR
Maillard reaction
- S-Powder
Powdered milk from Spanish
Authors' contributions
All authors (MR-M, MV, AR, YU, and AM) have participated in (a) conception and design, or analysis and interpretation of the data; (b) drafting the article or revising it critically for important intellectual content; and (c) approval of the final version.
Funding
Vice-Chancellor’s Office of Research (Colombia). MINECO (Spain): AGL2014-53445-R; AGL2017-84614-C2-1-R; CSIC (Spain): EMHE-CSIC 2017 MHE-200047.
Availability of data and materials
All data are available.
Code availability
Data are processed in Excel program.
Declaration
Conflicts of interest
The authors declare that they have no conflict of interest.
Consent for publication
All the authors give their consent to participate in this article.
Ethics approval
No experiments involving humans or animals have been conducted in this work.
Footnotes
Publisher's Note
Springer Nature remains neutral with regard to jurisdictional claims in published maps and institutional affiliations.
Contributor Information
Mar Villamiel, Email: m.villamiel@csic.es.
Antonia Montilla, Email: a.montilla@csic.es, http://www.cial.uam-csic.es, http://www.csic.es.
References
- Adhikari K, Dooley LM, Chambers E, Bhumiratana N. Sensory characteristics of commercial lactose-free milks manufactured in the United States. LWT- Food Sci Technol. 2010;43:113–118. doi: 10.1016/j.lwt.2009.06.017. [DOI] [Google Scholar]
- Aktag IG, Hamzalioglu A, Gokmen V. Lactose hydrolysis and protein fortification pose an increased risk for the formation of Maillard reaction products in UHT treated milk products. J Food Compost Anal. 2019;84:103308. doi: 10.1016/j.jfca.2019.103308. [DOI] [Google Scholar]
- Ameur LA, Mathieu O, Lalanne V, Trystram G, Birlouez-Aragon I. Comparison of the effects of sucrose and hexose on furfural formation and browning in cookies baked at different temperatures. Food Chem. 2007;101:1407–1416. doi: 10.1016/j.foodchem.2006.03.049. [DOI] [Google Scholar]
- Amigo-Benavent M, Villamiel M, Del Castillo MD. Chromatographic and electrophoretic approaches for the analysis of protein quality of soy beverages. J Sep Sci. 2007;30:502–507. doi: 10.1002/jssc.200600437. [DOI] [PubMed] [Google Scholar]
- AOAC (1990) Dairy products. In: Official methods of analysis of the association of official analytical chemists, vol II, 20th edn, pp 807–808
- Arques M, Pastoriza S, Delgado C, Clemente A, Rufian J. Relationship between glycation and polyphenol content and the bioactivity of selected commercial soy milks. J Agric Food Chem. 2016;64:1823–1830. doi: 10.1021/acs.jafc.6b00181. [DOI] [PubMed] [Google Scholar]
- Baptista JA, Carvalho RC. Indirect determination of Amadori compounds in milk-based products by HPLC/ELSD/UV as an index of protein deterioration. Food Res Int. 2004;37:739–747. doi: 10.1016/j.foodres.2004.02.006. [DOI] [Google Scholar]
- Birlouez-Aragon I, Morales F, Fogliano V, Pain JP. The health and technological implications of a better control of neoformed contaminants by the food industry. Pathol Biol. 2010;58:232–238. doi: 10.1016/j.patbio.2009.09.015. [DOI] [PubMed] [Google Scholar]
- Brereton KR, Green DB. Isolation of saccharides in dairy and soy products by solid-phase extraction coupled with analysis by ligand-exchange chromatography. Talanta. 2012;100:384–390. doi: 10.1016/j.talanta.2012.08.003. [DOI] [PubMed] [Google Scholar]
- Brobst K, Lott C. Determination of some components in corn syrup by gas liquid chromatography of trimethylsilyl derivates. Cereal Chem. 1966;43:35–42. [Google Scholar]
- Corzo-Martínez M, García-Campos G, Montilla A, Moreno FJ. Tofu whey permeate is an efficient source to enzymatically produce prebiotic fructooligosaccharides and novel fructosylated α-galactosides. J Agric Food Chem. 2016;64:4346–4352. doi: 10.1021/acs.jafc.6b00779. [DOI] [PubMed] [Google Scholar]
- EFSA Panel on Dietetic Products, Nutrition and Allergies (NDA) Scientific opinion on lactose thresholds in lactose intolerance and galactosaemia. EFSA J. 2010;8(1777):29. [Google Scholar]
- Fischer C, Kleinschmidt T. Synthesis of galactooligosaccharides in milk and whey: a review. Compr Rev Food Sci Food Saf. 2018;17:678–697. doi: 10.1111/1541-4337.12344. [DOI] [PubMed] [Google Scholar]
- Forero AC, Figueroa JD, Tobar JJ, Rada-Mendoza M. Análisis fisico-químico de leches UHT deslactosadas consumidas en la ciudad de Popayán. Rev Fac Nac Agron Medellin. 2014;67:1042–1044. [Google Scholar]
- Gibson GR, Hutkins RS, Sanders ME, Prescott SL, Reimer RA, Salminen SJ, Scott K, Stanton C, Swanson KS, Cani PD, Verbeke K, Reid G. Expert consensus document: The International Scientific Association for Probiotics and Prebiotics (ISAPP) consensus statement on the definition and scope of prebiotics. Nat Rev Gastroenterol Hepatol. 2017;14:491–502. doi: 10.1038/nrgastro.2017.75. [DOI] [PubMed] [Google Scholar]
- Guerra-Hernández E, Leon Gomez C, Garcia-Villanova B, Corzo Sanchez N, Romera Gomez JM. Effect of storage on non-enzymatic browning of liquid infant milk formulae. J Sci Food Agr. 2002;82:587–592. doi: 10.1002/jsfa.1078. [DOI] [Google Scholar]
- Kuo TM, Lowell CA, Nelsen TC. Occurrence of pinitol in developing soybean seed tissues. Phytochem. 1997;45:29–35. doi: 10.1016/S0031-9422(96)00795-9. [DOI] [Google Scholar]
- Li YH, Wang WJ, Guo L, Shao ZP, Xu XJ. Comparative study on the characteristics and oxidation stability of commercial milk powder during storage. J Dairy Sci. 2019;102:8785–8797. doi: 10.3168/jds.2018-16089. [DOI] [PubMed] [Google Scholar]
- Mahoney RR. Galactosyl-oligosaccharide formation during lactose hydrolysis: a review. Food Chem. 1998;63:147–154. doi: 10.1016/S0308-8146(98)00020-X. [DOI] [Google Scholar]
- Martínez-Villaluenga C, Cardelle-Cobas A, Corzo N, Olano A, Villamiel M. Optimization of conditions for galactooligosaccharide synthesis during lactose hydrolysis by a b-galactosidase from Kluyveromyces lactis (Lactozym 3000 L HP G) Food Chem. 2008;107:258–264. doi: 10.1016/j.foodchem.2007.08.011. [DOI] [Google Scholar]
- Masum AKM, Chandrapala J, Huppertz T, Adhikari B, Zisu B. Effect of storage conditions on the physicochemical properties of infant milk formula powders containing different lactose-to-maltodextrin ratios. Food Chem. 2020;319:126591. doi: 10.1016/j.foodchem.2020.126591. [DOI] [PubMed] [Google Scholar]
- Messia MC, Candigliota T, Marconi E. Assessment of quality and technological characterization of lactose-hydrolyzed milk. Food Chem. 2007;104:910–917. doi: 10.1016/j.foodchem.2006.12.045. [DOI] [Google Scholar]
- Ministry of Social Protection (2006) [homepage on the internet]. Decreto 616 de 2006. [Cited 2006 feb 28]. Colombia. Available from: https://www.ica.gov.co/getattachment/15425e0f-81fb-4111-b215-63e61e9e9130/2006D616.aspx.
- Montilla A, Megías-Pérez R, Olano A, Villamiel M. Presence of galactooligosaccharides and furosine in special dairy products designed for elderly people. Food Chem. 2015;172:481–485. doi: 10.1016/j.foodchem.2014.09.079. [DOI] [PubMed] [Google Scholar]
- Morales FJ, Jiménez-Pérez S. HMF Formation during heat-treatment of milk-type products as related to milkfat content. J Food Sci. 1999;64:855–859. doi: 10.1111/j.1365-2621.1999.tb15927.x. [DOI] [Google Scholar]
- Naranjo GB, Gonzales ASP, Leiva GE, Malec LS. The kinetics of Maillard reaction in lactose-hydrolyzed milk powder and related systems containing carbohydrate Mixtures. Food Chem. 2013;141:3790–3795. doi: 10.1016/j.foodchem.2013.06.093. [DOI] [PubMed] [Google Scholar]
- Pereyra-Gonzales AS, Naranjo GB, Leiva GE, Malec LS. Maillard reaction kinetics in milk powder: effect of water activity at mild temperatures. Int Dairy J. 2010;20:40–45. doi: 10.1016/j.idairyj.2009.07.007. [DOI] [Google Scholar]
- Rada-Mendoza M, Olano A, Villamiel M. Chemical indicators of heat treatment in fortified and special milks. J Agric Food Chem. 2005;53:2995–2999. doi: 10.1021/jf040406l. [DOI] [PubMed] [Google Scholar]
- Ruiz-Matute AI, Corzo-Martínez M, Montilla A, Olano A, Copovi P, Corzo N. Presence of mono-, di-and galactooligosaccharides in commercial lactose-free UHT dairy products. J Food Compos Anal. 2012;28:164–169. doi: 10.1016/j.jfca.2012.06.003. [DOI] [Google Scholar]
- SPSS . Real Stats, Real Easy, SPSS for Windows, version 9.0.1. Chicago, IL: SPSS Inc; 1999. [Google Scholar]
- Torres JKF, Stephani R, Tavares GM, Carvalho AF, Costa RGB, Schuck P, Perrone IT. Technological aspects of lactose-hydrolyzed milk powder. Food Res Int. 2017;101:45–53. doi: 10.1016/j.foodres.2017.08.043. [DOI] [PubMed] [Google Scholar]
- Tossavainen O, Kallioinen H. Effect of lactose hydrolysis on furosine and available lysine in UHT skim milk. Milchwissenschaft. 2008;63:22–26. [Google Scholar]
- Ugidos-Rodriguez S, Matallana-Gonzalez MC, Sanchez-Mata MC. Lactose malabsorption and intolerance: a review. Food Funct. 2018;9:4056–4068. doi: 10.1039/C8FO00555A. [DOI] [PubMed] [Google Scholar]
- Urgu M, Ecem Saatli T, Türk A, Koca N. Determination of hydroxymethylfurfural content of heat-treated milk (Pasteurized, UHT and lactose-Hydrolysed UHT Milk) Akademik Gıda. 2017;15:249–255. doi: 10.24323/akademik-gida.345258. [DOI] [Google Scholar]
- Van Renterghem R, De Block J. Furosine in consumption milk and milk powders. Int Dairy J. 1996;6:371–382. doi: 10.1016/0958-6946(95)00060-7. [DOI] [Google Scholar]
- WHO . Guideline: Sugars intake for adults and children. Geneva: World Health Organization; 2015. [PubMed] [Google Scholar]
- Zhang W, Poojary MM, Rauh V, Ray CA, Olsen K, Lund MN. Limitation of Maillard reactions in lactose-reduced UHT milk via enzymatic conversion of lactose into galactooligosaccharides during production. J Agric Food Chem. 2020;68:3568–3575. doi: 10.1021/acs.jafc.9b07824. [DOI] [PubMed] [Google Scholar]
Associated Data
This section collects any data citations, data availability statements, or supplementary materials included in this article.
Data Availability Statement
All data are available.
Data are processed in Excel program.