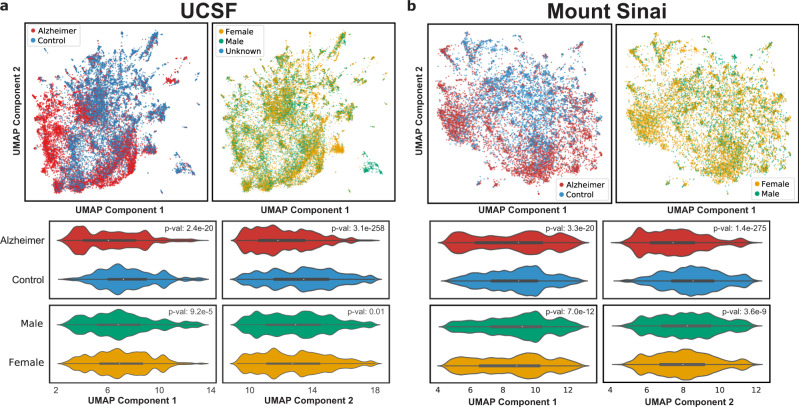
Fig. 2. UMAPs using comorbidities as features provide a topographical view of the distribution of patients.
Top row: UMAP of all patients (AD and controls), with each dot representing a patient, colored by AD status (a top left, b top left) or by sex (a top right, b top right). Middle and bottom rows: violin plots show the distribution of patients with AD and controls along the UMAP principal components for UCSF (a) and Mount Sinai (b), and p-values determined from comparing distributions with a two-sided Mann–Whitney U-test. Alzheimer vs Control: UCSF p-value 2.4e−20 (component 1) and 3.1e−258 (component 2). Mount Sinai p-value 3.3e−20 and 1.4e−275. Male vs female: UCSF p-value 9.2e−5 and 0.01. Mount Sinai p-value 7.0e−12 and 3.6e−9.

