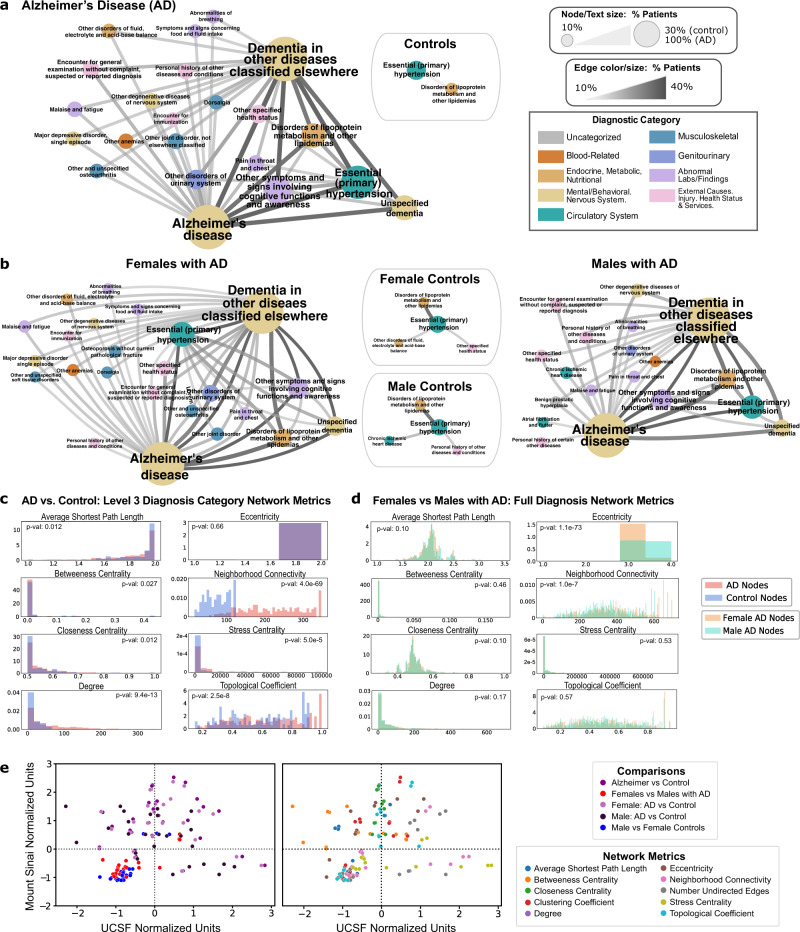
Fig. 3. Comorbidity networks show greater co-diagnosis in patients with AD vs. controls, and in females with AD vs males with AD.
a, b Network diagrams: For each network, the node size, text size, edge size, and edge color represent the number of patients sharing a diagnosis or diagnosis pair. Node colors are based on ICD-10-CM category. A threshold of 10% sharing was applied. a Network for Level 3 diagnosis categories in patients with AD vs. controls. Nodes and edges represent >10% of diagnosis or diagnosis pairs shared in each cohort, respectively. b Female and male network of Level 3 diagnosis categories for patients with AD and controls. Each node and edge represent a diagnosis or diagnosis pairs shared by >10% of males or females in the AD or control group. c Comparison of Level 3 diagnosis category network metrics between patients with AD and controls. Statistical tests are performed with a two-sided Mann–Whitney U-test. Significant metrics with p-value < 0.01: degree (9.4e−13), neighborhood connectivity (4.0e−69), stress centrality (5.0e−5), and topological coefficient (2.5e−8). d Comparison of network metrics between male and female Alzheimer’s disease full diagnostic name networks. Statistical tests are performed with a two-sided Mann–Whitney U-test. Significant metrics with p-value < 0.01: eccentricity (1.1e−73) and neighborhood connectivity (1.0e−7). e Correlation of network metrics compared with validation EMR network metrics, normalized by the metric. Colors represent comparison type (left) or the specific network metric (right), Spearman’s ρ = 0.55, p-value < 1e−4.

