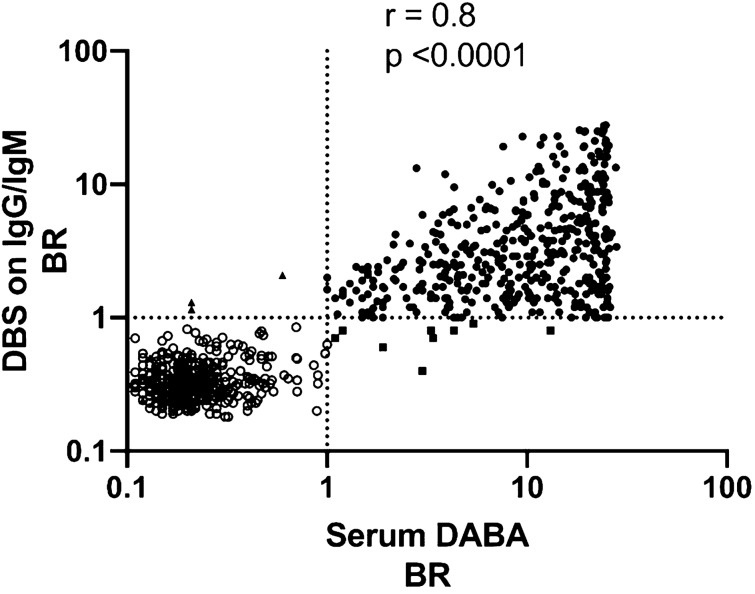
Figure 2.
Correlation of BRs from S1 Ig assays using DBS eluates and Hybrid DABA assay using serum. Serum samples and paired DBS eluates from 439 sero-positive and 382 sero-negative individuals were assayed using hybrid DABA and the S1 IgG and IgM capture assays, respectively. BRs from DABA serum assay were plotted against those generated from the DBS eluate on a Log10 scale. Samples from sero-positive individuals are shown with filled circles and those from sero-negative individuals with empty circles. Correlation of the DBS and serum BRs with each assay is shown graphically along with the coefficient of correlation, r, and the significance, p, generated using PRISM software. The dotted lines represent the cut-off for each assay. Discordant samples, namely those that were DABA-positive and DBS-negative (n = 9) are represented by a square and samples which were DABA-negative and DBS-positive (n = 3) represented by a triangle.

