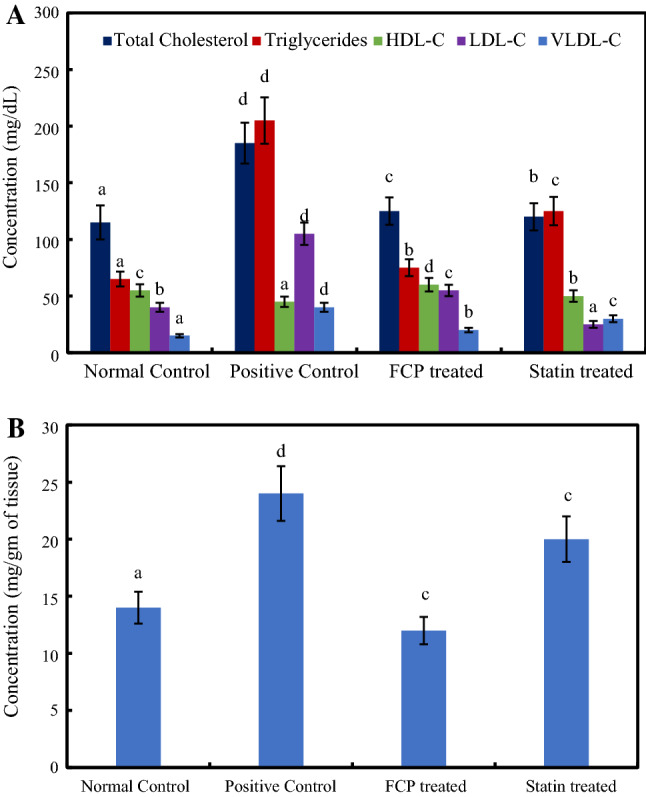
Fig. 2.

A Lipid profile of serum samples B Levels of cholesterol accumulation in the hepatic tissues of experimental rats. *Mean values ± standard deviation, n = 6. Values that have different superscript letters differ significantly (P < 0.05) with each other
