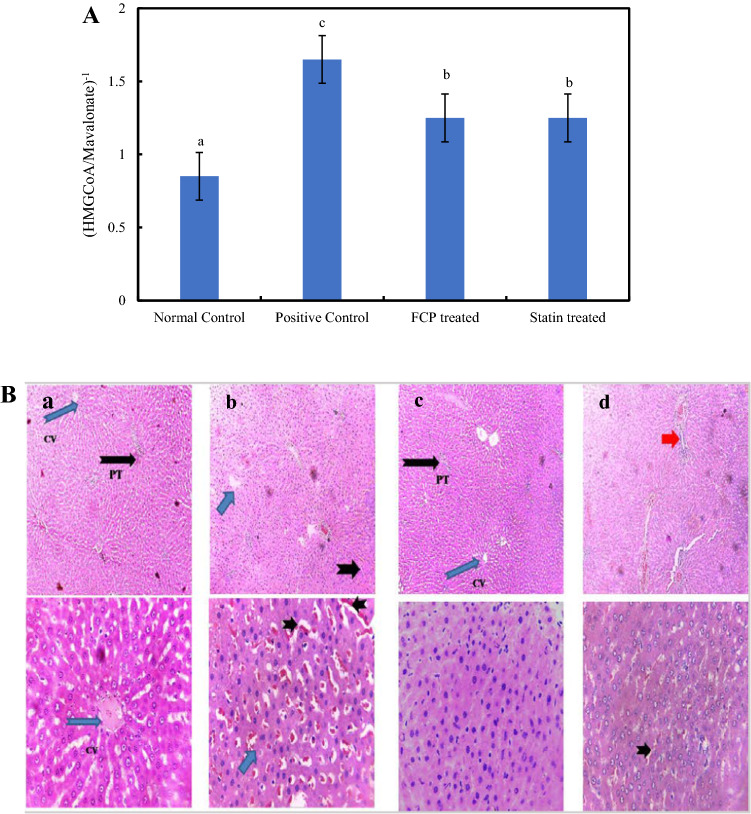
Fig. 4.
A Effect of FCP on the activity levels of HMGCR in liver tissues of experimental rats. *Mean values ± standard deviation. Values that have different superscript letters differ significantly (P < 0.05) with each other. B. Microscopic evaluation of the histopathology sections of hepatic tissues of experimental animals at low (10X) and high (40X) magnification. a Normal Control b Positive Control c FCP treated and (d) Statin treated. Short blue arrow indicates micro vesicular steatosis, Short black arrow shows inflammatory infiltration and Red arrow point out bridging fibrosis

