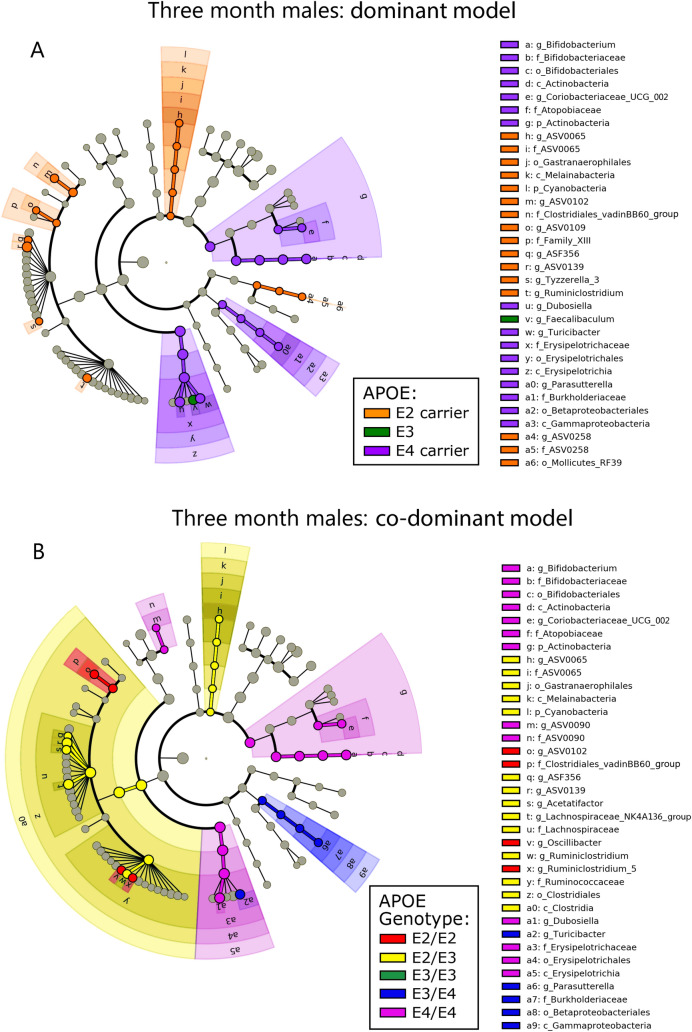
Figure 1.
Cladograms reveal microbial phylogenetic branches associated with APOE status in males. Taxa are represented as nodes and are connected by lines based on the phylogenetic relatedness of all taxa present in each experimental cohort. For example, the end node, a. represents the genus Bifodobacterium which is connected to other nodes representing higher level taxa related to Bifodobacterium including; b. the family Bifidobacteriaceae, c. the order Bifidobacteriales, and d. the class Actinobacteria. Many taxa are associated with APOE genetics, with node colors indicating the APOE associated with highest levels of that taxa. Statistical significance reflects both p < 0.05 for Kruskal–Wallis tests and a logarithmic LDA score > 2.0.

