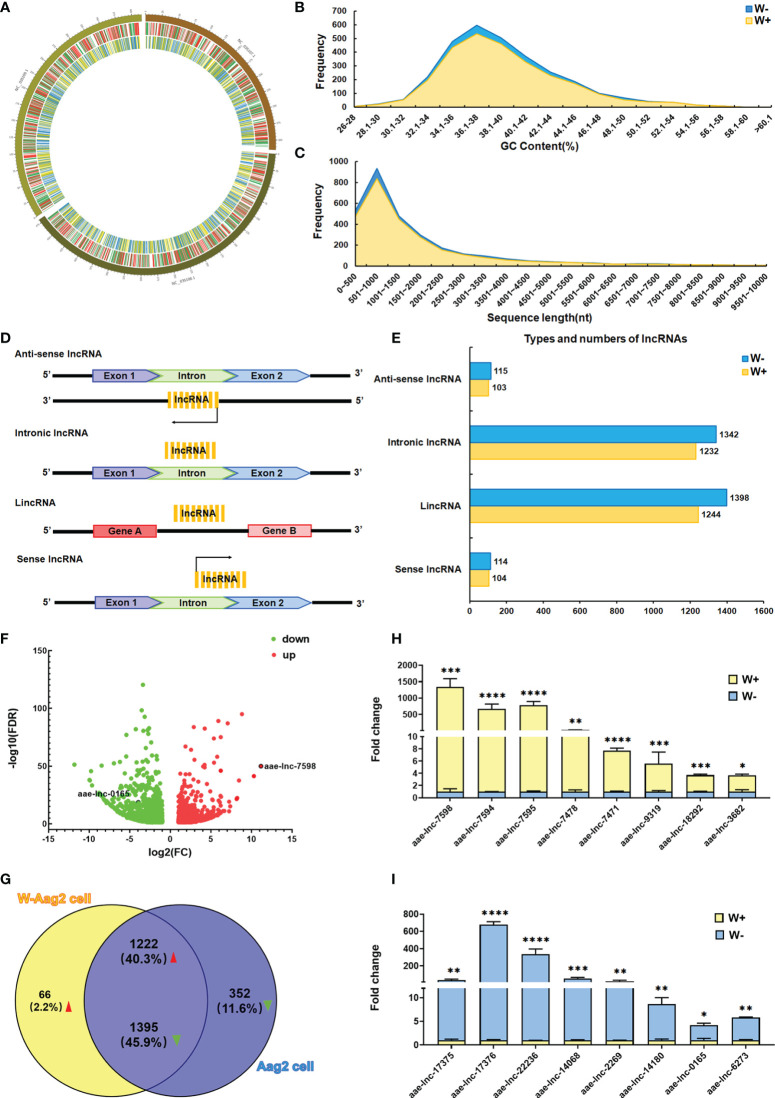
Figure 1.
Wolbachia wAlbB induces differential expression of lncRNA in A. aegypti. (A) Distribution of differentially expressed (DE) lncRNAs and mRNAs on a chromosome map. The outer circle shows the chromosome map of A. aegypti, the middle circle indicates the distribution of DE mRNAs on the chromosomes of A. aegypti, and the inner circle shows the distribution of DE lncRNAs on the chromosomes of A. aegypti. The red and green lines in the circle represent upregulated genes and downregulated genes, respectively. Yellow and blue lines represent up-regulated lncRNAs and down-regulated lncRNAs, respectively. (B) The GC content of DE lncRNAs identified in A. aegypti. (C) The length distribution of identified DE lncRNAs. (D) Schematic diagram of the origin and type of lncRNAs. (E) Types and numbers of DE lncRNAs; the lncRNAs are classified into four types. For each type of lncRNA, the number of lncRNAs per cell line are presented in different colors. (F) Volcano maps of 3035 DE lncRNAs; the red dots indicate upregulated lncRNAs, green dots indicate downregulated lncRNAs. (G) Venn diagram of the 3035 DE lncRNAs in A. aegypti. qPCR validation of significantly down-regulated lncRNAs (H) and up-regulated lncRNAs (I) in lncRNA sequencing; ****P < 0.0001; ***P < 0.001; **P < 0.01, *P < 0.05.

