Figure 2.
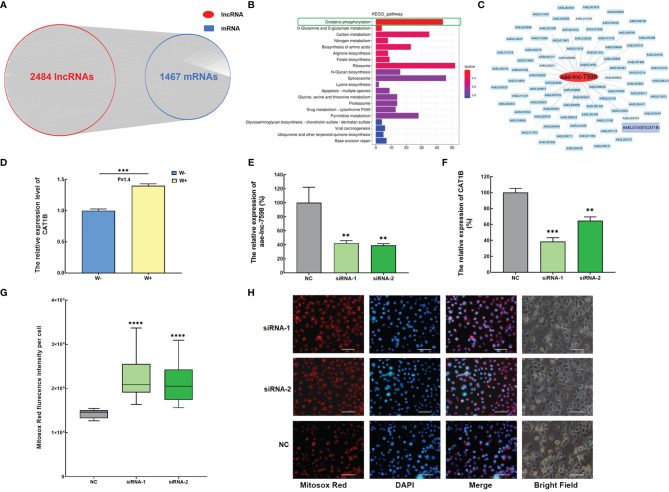
Wolbachia induces aae-lnc-7598 to mediate trans-regulation of the antioxidant catalase 1B gene to balance intracellular ROS stress in A. aegypti. (A) The co-expression network of DE lncRNA-mRNA via trans-regulation mechanism. (B) KEGG pathway enrichment analyses of DE lncRNA via trans-acting. (C) The co-expression network of aae-lnc-7598. The red circle represents aae-lnc-7598, while the blue rectangle represents mRNA. Among them, the purple rectangular represents the CAT1B gene. (D) The relative expression level of CAT1B in W-Aag2 (W+) and Aag2 cells (W-). (E) The relative expression of aae-lnc-7598 at 72-hour post transfection. (F) The relative expression of CAT1B gene at 72-hour post transfection. (G) The fluorescence intensity of mitochondrial ROS per cell at 72-hour post-transfection using the Mitosox Red probe. The bar represents the range of maximum and minimum value, and the horizontal shows the median. NC represents W-Aag2 cells transfected with siRNA control; siRNA-1 and siRNA-2 represent the aae-lnc-7598 depleted W-Aag2 cells obtained by transfection with two individual siRNAs of aae-lnc-7598. (H) Representative image of siRNA-transfected W-Aag2 cells at ×40 magnification. The mitochondrial ROS and nucleus were stained with Mitosox Red probe (red) and DAPI (blue). The white line indicates 50 micrometers; ****P < 0.0001; ***P < 0.001; **P < 0.01. F means fold change.

